You have /5 articles left.
Sign up for a free account or log in.

Getty Images

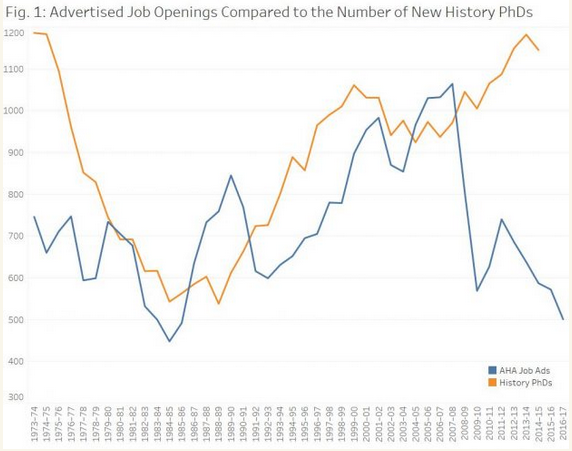
The academic job market keeps getting tighter for historians.

During the period from June 2016 to June 2017, the American Historical Association posted 501 listings for full-time positions, a 12 percent decline from the year before. This was the fifth straight year that the number of postings was down. Adding to the concern is that the number of new Ph.D.s in history is routinely more than twice the number of positions being posted by the AHA.

Figure 1: Advertised Job Openings Compared to the Number of New History Ph.D.s. Line graph compares American Historical Association job ads to Ph.D.s awarded from 1973 to 2017.

It is important to note that not all faculty jobs in history are listed with the AHA. That said, most experts on the academic job market say association studies like this one reflect broad trends in various disciplines.

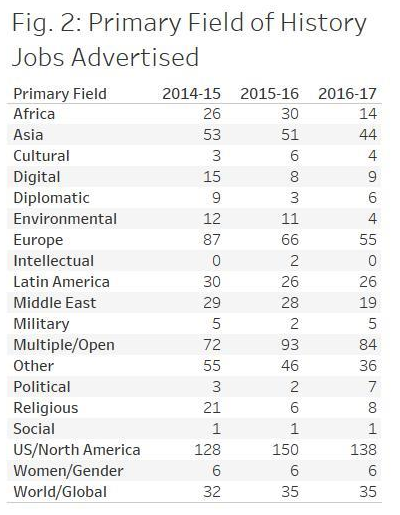
History is among the many fields where specialization is crucial in the job search.

American history tends to have the greatest number of jobs (and job applicants). In recent years, as many history departments have moved to diversify their offerings, the history job market has been healthiest in fields such as Asian and African history, where many departments lack expertise they seek. But this year, those fields, Middle Eastern history and environmental history saw larger percentage declines than did American history. Latin American history, however, was flat.

Figure 2: Primary Field of History Jobs Advertised. For African history, 26 in 2014-15, 30 in 2015-16, and 14 in 2016-17. For Asian history, 53 in 2014-15, 51 in 2015-16, and 44 in 2016-17. For cultural history, 3 in 2014-15, 6 in 2015-16, and 4 in 2016-17. For digital history, 15 in 2014-15, 8 in 2015-16, and 9 in 2016-17. For diplomatic history, 9 in 2014-15, 3 in 2015-16, and 6 in 2016-17. For environmental history, 12 in 2014-15, 11 in 2015-16, and 4 in 2016-17. For European history, 87 in 2014-15, 66 in 2015-16, and 55 in 2016-17. For intellectual history, zero in 2014-15, 2 in 2015-16, and zero in 2016-17. For Latin American history, 30 in 2014-15, 26 in 2015-16, and 26 in 2016-17. For Middle Eastern history, 29 in 2014-15, 28 in 2015-16, and 19 in 2016-17. For military history, 5 in 2014-15, 2 in 2015-16, and 5 in 2016-17. For multiple fields/open, 72 in 2014-15, 93 in 2015-16, and 84 in 2016-17. For other, 55 in 2014-15, 46 in 2015-16, and 36 in 2016-17. For political history, 3 in 2014-15, 2 in 2015-16, and 7 in 2016-17. For religious history, 21 in 2014-15, 6 in 2015-16, and 8 in 2016-17. For social history, 1 in 2014-15, 1 in 2015-16, and 1 in 2016-17. For U.S./North American history, 128 in 2014-15, 150 in 2015-16, and 138 in 2016-17. For women’s and gender history, 6 in 2014-15, 6 in 2015-16, and 6 in 2016-17. For world/global history, 32 in 2014-15, 35 in 2015-16, and 35 in 2016-17.

Next Story

Written By

More from Faculty Issues