You have /5 articles left.
Sign up for a free account or log in.
The growth of college tuition may be the trend that grabs headlines, but its slope can’t match that of how much the top football-playing universities spend on athletes.
The amount of athletics spending per athlete at universities in the National Collegiate Athletic Association’s Football Bowl Subdivision grew by about 50 percent between 2005 and 2010, compared to a 38 percent increase in in-state student tuition at public four-year universities, according to a report released today by the Delta Cost Project, a branch of the American Institutes for Research, entitled "Academic Spending Versus Athletic Spending: Who Wins?”
According to the report, the growth in per-athlete athletic spending outpaced the growth in per-student academic spending over that time period in all subdivisions of Division I athletics. In general, the report found that Division I universities and colleges tended to spend roughly three to six times as much on athletics per athlete as on academics per student, with the ratio exceeding 12 times in the Southeastern Conference, home of the last seven NCAA national champions in football.
The Delta report builds on the work of the Knight Commission on Intercollegiate Athletics, which in 2010 released “Restoring the Balance: Dollars, Values, and the Future of College Sports,” which compared academic and athletic spending at colleges and universities and made recommendations for “restoring academic values” and “strengthening accountability for intercollegiate athletics.”
Whether comparing per-student academic funding and per-athlete funding for athletics is valuable to the debate is an open question. Many in higher education argue that participation in Division I athletics generates benefits for the entire institution, including donations, applications, regional economic returns, school spirit and even state support.
But if those returns are true (which both the report and recent research question), the new Delta report says that may not be enough to justify the divergent trends in academic and athletic spending, especially during an economic downturn. “Possible benefits aside, comparisons of spending on athletics and academics raise questions about institutional priorities and whether rising athletic subsidies are appropriate, particularly in the current budgetary environment,” the report states. “For many institutions, spending on athletics is sacrosanct, even when academic spending (such as for faculty pay and academic programs) is being cut or frozen.”
The report did not explore the financing of Division II or Division III programs.
The report notes that, during the downturn, while many institutions faced financial pressure and cut academic programs, only a few Division I institutions – including the University of Maryland at College Park, the University of California at Berkeley, and Rutgers University – cut athletic teams or spending to cope with budget cuts. The University of Maryland has since moved to a different conference in hopes of generating more revenue and restoring the cut programs.
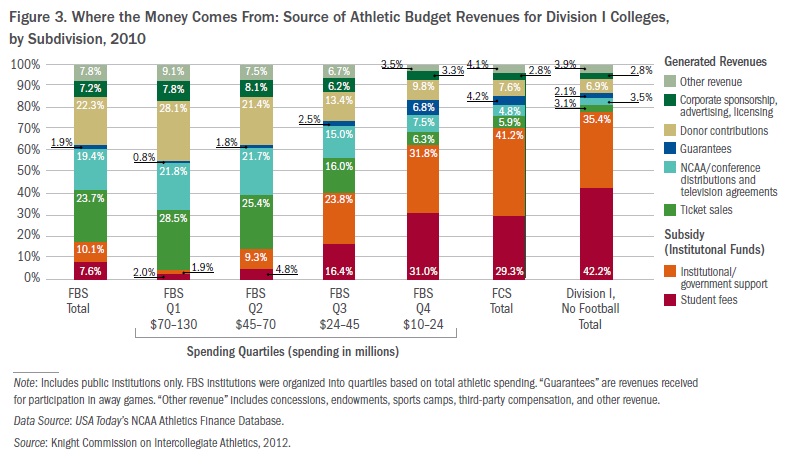
 The report finds wide variation in how institutions fund their athletic programs, with the largest FBS programs employing a different financial model from other institutions. For institutions in the FBS subdivision, more than 80 percent of revenues came from “generated” sources such as ticket sales, conference payouts and donations. The report notes that newly negotiated television contracts – often the result of conference realignment – will bring in more revenues for the largest programs, increasing the disparities. At FCS and non-football institutions, trends were reversed, with more than 70 percent of athletics funding from institutional subsidies and student fees.
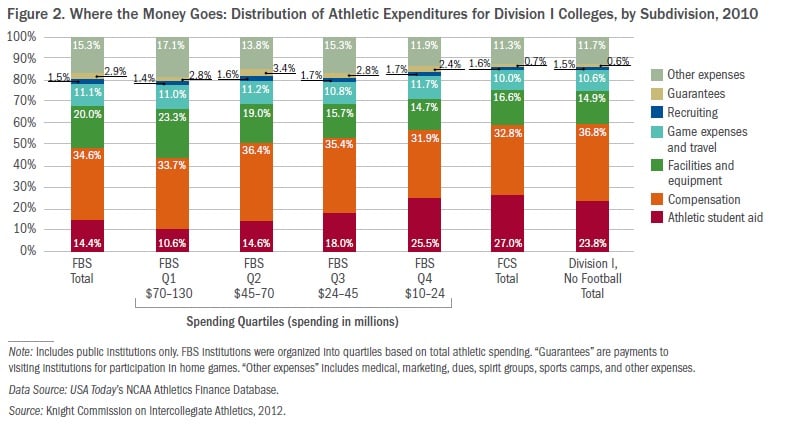
 On the expense side, FBS universities spent a larger share of their budget on facilities and equipment than non-FBS institutions. All subdivisions spent roughly the same percentage on coaches' salaries.
Within the FBS, however, the budgets for the smallest quartile of athletics departments more closely resembled those of the FCS and non-football schools, in terms of both revenues and expenses.
Institutions in the middle two quartiles of the FBS saw their spending increase the most over the time period and saw a greater share of their athletic department revenues come from institutional support rather than generated revenues. “While these midlevel institutions were aggressively trying to reach the top tier, the bottom quartile of institutions appeared more inclined to accept their less competitive position,” the report states.
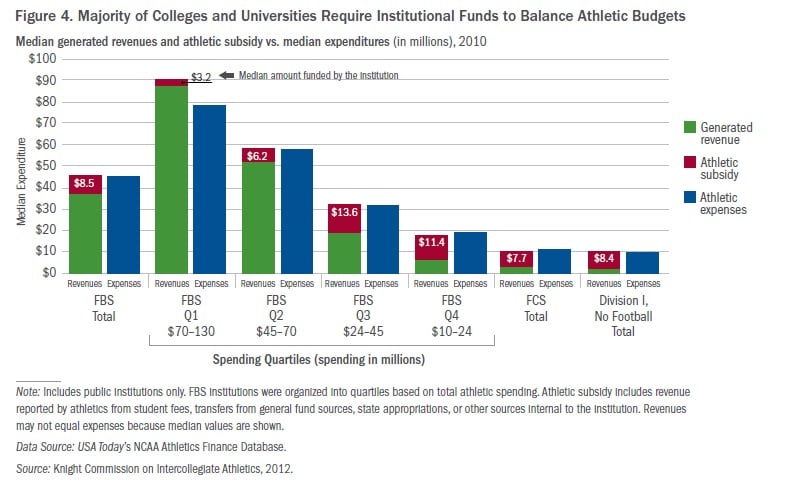
 The report notes -- as have many others -- that most athletic departments are not self-supporting. Only one in four institutions in the FBS generated more money than it spent in any given year between 2005 and 2010, the report states, with almost none of the FCS or non-football programs generating a profit. Median subsidies for Division I institutions ranged from $7.7 million to $8.5 million, with the largest FBS institutions seeing the smallest subsidies and the smallest FBS institutions seeing the largest.
“The belief that college sports are a financial boon to colleges and universities is generally misguided," the report states. "Although some big-time college sports athletic departments are self-supporting – and some sports may be profitable enough to help support other campus sports programs – more often than not, the colleges and universities are subsidizing athletics, not the other way around.”
What counts?
Athletics Expenses:
- Guarantees (revenues given to visiting teams)
- Recruiting
- Game expenses and travel
- Facilities and equipment
- Compensation
- Athletic student aid
- Other associated expenses, including medical, marketing, dues, spirit groups and sports camps
Athletics Revenues:
- Corporate sponsorship, advertising and licensing
- Donor contributions
- Guarantees
- NCAA and conference distributions and television agreements
- Ticket sales
- Institution and government subsidy
- Student fees
“Education and Related” Expenses (a metric developed by the Delta Cost Project):
- Instruction
- Student services
- Portion of academic and instructional support
- Portion of operations and maintenance


