You have /5 articles left.
Sign up for a free account or log in.
In its 15th year, the National Survey of Student Engagement launched a new model that takes an updated and more qualitative approach to measuring students’ participation in a variety of activities -- from studying to faculty interaction to cooperative learning -- that are thought to correlate with higher learning outcomes.
Results show that while many students engage in such practices – and report better grades for it – many others, whether because of their major or their status as online or first-generation students, don’t.
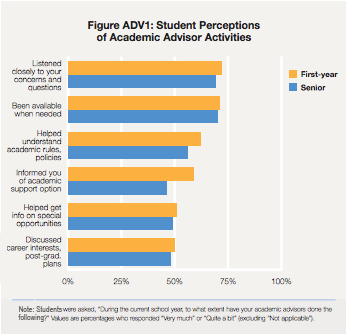
And in a special section examining students’ use of academic advisers, NSSE (pronounced "Nessie") found some disconcerting results.
“If one student in 10 never sees an adviser, that’s really a shocker,” NSSE Director Alexander C. McCormick said during a recent visit to Inside Higher Ed, where he discussed the revised survey and its findings. “It’s an enduring issue, and I think a lot of institutions are challenged by that.”
In fact, only 40 percent of students identified an adviser as their primary source of academic advice; others turned to friends, family and professors. This is “concerning,” the report says, given the importance of advising in student success.
“Are they not getting what they need, or do they think they don’t need it?” asked McCormick, who is also an associate professor of educational leadership and policy studies at Indiana University.
First-year students and seniors averaged 14 and 15 hours per week, respectively, preparing for class, with a little less than half that time spent on assigned reading. Results varied by majors, though; at 18 hours, engineers spent the most time preparing for class, while communications, media and public relations majors rounded out the group with 12 hours.
Only about 55 percent of freshmen and 61 percent of seniors said their courses “challenged them to do their best work.” While 70 percent of senior health professions majors felt highly challenged, communications majors (53 percent) felt the least challenged.
This year’s NSSE respondents include nearly 335,000 first-year and senior students at 568 four-year colleges and universities who took the survey in the spring. While NSSE reports the results en masse annually, institutions can also view and track their individual results over time.
It’s been four years since NSSE’s authors first thought to update the survey, after growing concern that some questions were showing their age (“How often do you use emails to communicate with an instructor?”), while others, with a focus on writing and reading load, seemed biased toward liberal arts scholarship, McCormick said. As he put it in the report, there was a “need to adapt in response to accumulated experience, new research findings, and changes in the nature and context of undergraduate education.”
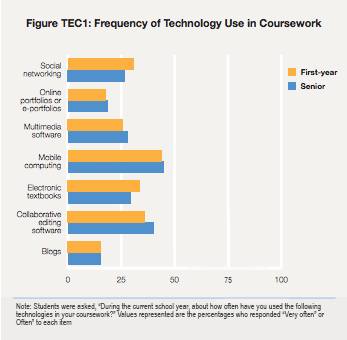
The 2013 edition includes new and refined questions on the student experience (learning strategies, effective teaching practices, quality of interactions, etc.). It also offers new topical modules comprising short, focused question sets (in this case, on academic advising and learning with technology) that institutions can choose to add on to the basic NSSE content.
This year’s set of experimental questions, which focus on a timely topic (last year, the economy) explored students’ use of course evaluations. Although about 9 in 10 students have completed an evaluation, only a third of freshmen and one-fifth of seniors said they use the forms when choosing courses.
“It didn’t surprise me at all, but I do think there’s an issue here to be explored by higher education,” McCormick said. “There’s this interaction between availability and use.”
That means that if evaluations aren’t available to students (as is the case at 76 percent of baccalaureate colleges, two-thirds of doctorate-granting institutions and 54 percent of master’s-level colleges), students might be looking to outside sources like Ratemyprofessors.com that aren’t necessarily reliable.
“It’s essentially ceding that ground and ceding that responsibility to these external providers,” McCormick said.
Turns out, lots of faculty don’t use the evaluations, either: a little more than half of professors and associate professors look to their results to improve their courses, compared to two-thirds of assistant professors and lecturers.
But NSSE’s focus is on student behavior.
“An ineffective educational program is always more expensive in the long run than an effective one,” Paul E. Lingenfelter, a member of NSSE’s national advisory board and former president of the State Higher Education Executive Officers association, wrote in the report. “Monitoring the student experience and pursuing higher levels of student engagement will pay dividends in learning, retention, persistence and completion.”
In its new iteration, NSSE measures engagement via four “ ‘Engagement Indicators,’ representing broad dimensions of the student experience associated with learning and development”: academic challenge, learning with peers, experiences with faculty, and campus environment. Each category has a subgroup of topics (also called engagement indicators) that are examined in more depth.
Academic Challenge
For example, academic challenge includes higher-order learning, which occurs when students’ coursework emphasizes more complex thinking skills; reflective and integrative learning, which requires students to personally connect with the course material through prior knowledge and experiences; learning strategies; and quantitative reasoning.
In general, seniors who said they were highly challenged in class reported almost double the course emphasis on higher-order learning than did their peers who were not challenged. And the courses that emphasized higher-order learning included more reading, writing assignments and reports that challenged students to approach the material in “deeper ways.”
Students' feeling of being challenged was also linked to reflective and integrative learning, though to a lesser extent than with higher-order learning.
The learning strategies that NSSE has long said improve academic performance (taking notes when reading, summarizing and organizing new information, etc.) again were linked to higher self-reported grades. Certain groups used these strategies more often: adult and online students, and first-generation students, transfers and students living off-campus (perhaps because they have to be more deliberate in scheduling their time, McCormick posited). Seniors majoring in health and social service professions do things like review notes after class and identify key reading information most often, while engineering and physical sciences, mathematics and computer sciences majors do so least often.
“Higher education has traditionally operated on the assumption that students know how to be students,” McCormick said, “and that’s not necessarily the case.”
The NSSE authors also write, “In today’s information age, employers demand quantitative skills from college graduates regardless of career." Judging by their results, some majors will be more prepared than others. While seniors in science, technology, math and engineering engaged most often in quantitative reasoning activities, arts and humanities majors did so the least.
Learning With Peers
Engineering and science students also did more collaborative learning (seeking help, preparing for exams or assignments, and reviewing course material with other students) than did those studying other majors. First-generation, online and adult students were less likely to learn collaboratively, as were those enrolled at institutions with more than 2,500 students.
Students who interacted with diverse peers engaged in more deep learning activities and perceived a more supportive campus environment and positive interaction with other students, faculty and staff. The students who participated in formal leadership programs or service learning and lived on campus had the most diverse interactions.
Experiences With Faculty
As past NSSE editions have found, students who were enrolled full-time or lived on campus, as well as varsity athletes, interacted most often with faculty members. Online and veteran students were less likely to interact. And, of course, students at smaller institutions talked to faculty more.
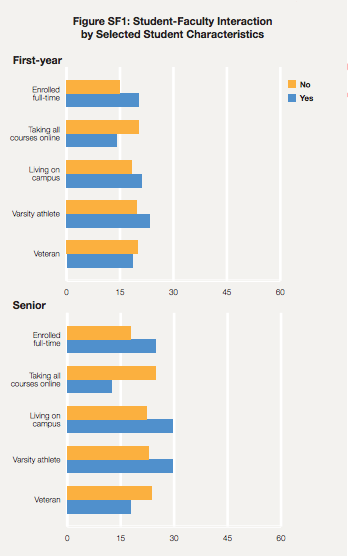
(Scale above represents NSSE engagement indicator scores.)
Students whose teachers are clear, organized and provide prompt feedback are more likely to see positive learning outcomes, NSSE authors note, before revealing that seniors in arts and humanities and social service professions experienced the highest levels of effective teaching practices. Engineering students experienced the least. For example, "85 percent of arts and humanities seniors said their instructors clearly explained course goals and requirements, compared to 77 percent of engineering students."
Campus Environment
“While students over all were pleased with their campus interactions, there were differences by student subpopulation as well as institutional type,” the report says. Students throughout the disciplines reported similar experiences. But perhaps oddly, depending how one looks at it, students who took all their classes online reported higher-quality interactions than did students who were actually on campus to interact with people.
The report also optimistically notes that results did not vary by students’ race or sexual orientation, or for students who have disabilities. “These results may be encouraging for institutions that have taken care to promote inclusive environments on their campuses,” the authors write.
But in terms of support on campus, there were some differences. Veterans and transfer, adult, part-time, online and off-campus students found the campus environment less supportive than their peers did. Some, if not many, of those students may have off-campus commitments that keep them off campus and away from extracurricular activities, the report speculates.
The survey also measured students’ use of “high-impact practices,” special undergraduate opportunities that have positive effects on student learning and retention. Selected results are below.
| Learning Community | Service-learning | Research with Faculty | Internship/Field Experience | Study Abroad | Culminating Experience | |
| Female | 26 | 64 | 22 | 49 | 14 | 44 |
| Male | 21 | 55 | 24 | 46 | 11 | 45 |
| Part-Time | 14 | 52 | 13 | 32 | 5 | 31 |
| Full-Time | 26 | 62 | 26 | 52 | 15 | 48 |
| Major: Arts & Humanities | 22 | 55 | 27 | 42 | 24 | 57 |
| Major: Biological Sciences, Agriculture, Natural Resources | 25 | 54 | 45 | 53 | 16 | 45 |
| Major: Physical Sciences, Math, Computer Science | 20 | 42 | 39 | 45 | 11 | 45 |
| Major: Social Sciences | 20 | 60 | 30 | 45 | 17 | 46 |
| Major: Business | 19 | 53 | 12 | 38 | 12 | 41 |
| Major: Communications, Media, Public Relations | 26 | 67 | 22 | 64 | 19 | 58 |
| Major: Education | 35 | 82 | 15 | 67 | 10 | 47 |
| Major: Engineering | 28 | 44 | 30 | 58 | 10 | 55 |
| Major: Health Professions | 29 | 76 | 18 | 50 | 8 | 35 |
| Major: Social Service Professions | 24 | 69 | 15 | 46 | 6 | 39 |
| Major: Undeclared | 17 | 63 | 16 | 30 | 12 | 25 |
| Overall | 24 | 60 | 23 | 48 | 13 | 45 |
Source: National Survey of Student Engagement
Note: This article has been updated to reflect more accurate data.