You have /5 articles left.
Sign up for a free account or log in.

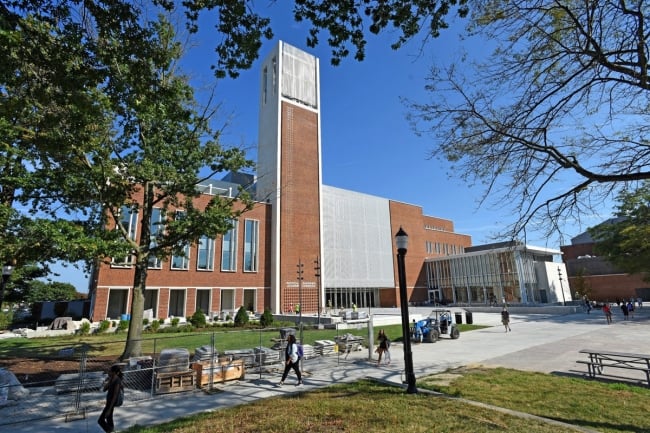
Salisbury is one of the University System of Maryland's 12 campuses.
Salisbury University
PHILADELPHIA -- The University System of Maryland determined four years ago that it needed a unified strategy for improving student success through standardized data collection and analysis at its 12 campuses -- including the flagship University of Maryland campus near Washington, smaller rural locations and historically black colleges. While the main campus maintains a highly selective enrollment process, some others with large proportions of minority and low-income students struggle with lower retention and graduation rates.
“We [needed] to understand … what does it mean when we put interventions into place?” said M.J. Bishop, director of the system’s center for academic innovation, during a panel at last week’s Educause conference here. “How do we know whether or not we’re making a difference when we put these interventions into place?”
What followed was a process of introspection and realignment that the system’s leaders believe has moved the campuses toward a level playing field: standardizing disparate definitions for student success data and identifying areas where students need more help than they’re getting, particularly in the classroom and before they arrive on campus for the first time.
Evolving Priorities
The system’s Board of Regents convened an academic innovation task force years earlier to address what Bishop said during the Educause conference was “low-hanging fruit” -- issues of effectiveness and efficiency including pursuing energy certification for campus buildings, fixing procurement systems and printing fewer documents on paper.
The focus then shifted to the ongoing desire to close achievement gaps for students. The system wanted to get away from what Bishop called “rearview mirror” analysis -- wondering why, for example, a student left an institution after two years -- and toward taking proactive steps to improve learners’ academic experiences and ensure retention.
The system campuses have significant variation in retention and graduation rates, according to 2016 data, the most recent available on the system’s website. Data from three campuses are listed below.
|
|
2-year retention |
4-year retention |
4-year graduation |
6-year graduation |
|
Coppin State University |
61% |
38% |
9% |
17% |
|
Frostburg University |
76% |
56% |
27% |
47% |
| University of Maryland College Park |
95% |
87% |
66% |
85% |
Source: University System of Maryland
Each Maryland campus has its own corporate partner for data collection -- among them EAB (formerly Education Advisory Board), Civitas, Blackboard and several others -- but until recently the system had no easy way to compare the data or understand the information on a global level.
“Nothing seemed to be really looking at ways that we could capitalize on the collective power of the analytics across the system and begin building upon that kind of information,” Bishop said.
One of the biggest obstacles, according to Bishop, was the lack of standard definitions for terms like “retention” and “success.” Because each institution had its own metrics, identifying trends was virtually impossible.
Taking Concrete Steps
For help addressing those issues, the system turned to the Predictive Analytics Reporting framework, an initiative funded by the Bill & Melinda Gates Foundation that offers support for institutions looking to organize data collection. The PAR framework identified traditional sticking points for creating common data definitions, which meant the system could skip ahead to fixing those definitions.
“Unless you started to have conversations about it and realized ‘I thought everybody defined retention this way,’ you wouldn’t have unearthed this problem,” Bishop said.
Five institutions in the system -- Bowie State University, University of Maryland Eastern Shore, Coppin State University, Frostburg State University and University of Maryland University College -- opted for full implementation of the PAR framework last year. Those institutions were the ones within the system -- including three historically black colleges and an online university -- that most needed funding support for data collection, according to Bishop. The remaining seven forged ahead with data collection and analysis initiatives, akin to the PAR framework, that were already in progress.
In January 2016 the entire system started making use of PAR’s Student Success Matrix, an inventory form that asks institutions to provide information about their formalized intervention procedures for students at four stages of their academic careers: connection (between acceptance and arrival), entry, progress and completion.
That process revealed a few key trends. Most interventions at the Maryland campuses were aimed at students during the entry stage, with far fewer influencing them at connection and completion. The inventory revealed that zero interventions were in place at the faculty level. Redundancies frequently popped up, with similar orientation programs offered through numerous academic departments within an institution when only one was necessary.
“That was really surprising to us, since students spend most time with faculty members,” Kimberly Whitehead, interim provost and vice president at the University of Maryland Eastern Shore, said at Educause.
At Bowie State, for instance, the inventory highlighted that the institution’s three tutoring centers don’t communicate or coordinate with one another.
“We’re now having conversations to bring this all together,” Gayle Fink, Bowie State’s assistant vice president for institutional effectiveness, said during the conference. “We wouldn’t have done this if we didn’t have a common framework.”
Based on the inventory, Maryland’s academic innovation team this spring recommended several approaches for improving student success initiatives systemwide:
- Adding more connection interventions
- Developing a more systematic approach for data sharing going forward
- Establishing a central repository for data collection
- Creating and designing templates for future interventions
More Work to Be Done
Those changes won’t happen overnight, Bishop said in a phone interview. Administrative and faculty leaders need to be consulted. Institutions with full subscriptions to the PAR framework have more intensive studies to conduct. The system’s Board of Regents will expect more quantitative data to back up the qualitative analysis that’s already been gathered.
“It’s about getting regents to be willing to take a 10-page report that describes the institutions’ reflections on these things, what they’re going to do about it -- a more meaningful and actionable exercise,” Bishop said.
For other systems looking to undertake a similar process, Bishop recommends ensuring that plenty of administrators look at the data, and that a centralized office oversees disparate data efforts. Still, giving campuses wide latitude has paid off so far, she said.
“It was not about going in and saying, ‘Everybody must use Civitas,’ trying to do something from the top down -- that never would have worked,” Bishop said. “I hope we helped to make things explicit that weren’t necessarily readily seen prior to that in terms of the lack of collecting data.”


