You have /5 articles left.
Sign up for a free account or log in.
Six years ago, there were almost three times as many students enrolled in private nonprofit colleges as there were at for-profit institutions. By 2008-9, that ratio had slipped to about 2 to 1.
That is just one of many indicators, in data released by the U.S. Education Department Tuesday, of the boom in the sector of higher education alternatively called for-profit/private sector/corporate. The report from the National Center for Education Statistics, "Enrollment in Postsecondary Institutions, Fall 2008; Graduation Rates, 2002 and 2005 Cohorts; and Financial Statistics, Fiscal Year 2008," also provides an initial peek (from a point relatively early in the recession) at how the continuing economic downturn has begun to reshape the enrollment and financial picture of higher education.
Among the highlights:
- Overall enrollments at postsecondary institutions that award federal student aid grew by 4.8 percent in the fall of 2008, nearly double the 2.6 percent increase from 2006 to 2007. The growth was almost certainly driven by the onset of the recession, as poor economic times tend to send Americans (especially the jobless) back to school. Every sector of higher education saw increases, but the biggest gains by far occurred in the private sector, where the one-year increase was 21.1 percent. While the base remains small, enrollments at for-profit institutions represented 9.2 percent of the total in 2008.
- The proportion of students receiving some financial aid edged up, to 76.4 percent in 2007-8 from 73.4 percent in 2006-7.
- Another impact of the economy may be found in the institutional revenue and expense figures in the federal report. In the 2007 fiscal year, as reported in last year's version of the federal study, four-year public colleges reported total revenues of $213.1 billion and total expenses of $189 billion. In 2008, revenues were about the same -- $215.5 billion -- but expenses had soared to $208 billion. At four-year private colleges, meanwhile, overall expenditures grew by about $8 billion (from $124 billion to $133 billion) from 2007 to 2008, but revenues shrank drastically, to $139 billion in 2008 from $182 billion in 2007. The main culprit: a nearly $50 billion drop in the category called "investment return." Thank you, Wall Street.
Enrollments
As seen in the table below, virtually every sector of higher education enjoyed enrollment growth in fall 2008; the only exceptions were two-year private colleges, which have been steadily shrinking in number, and first professional programs, because of a reporting change (see note below table).
The increase of more than 900,000 total students from 2007 to 2008 challenges the frequent complaints from policy makers that higher education institutions cannot or will not add capacity to serve more students. Yes, more than a third of that increase came in the for-profit sector, which saw its share of the entire postsecondary market inch ever closer to 10 percent (it is likely to be well above that now, given how career college enrollments have swelled in recent months).
But public colleges added 500,000 seats from 2007 to 2008, as well, with about two-thirds of that increase coming at community colleges.
Enrollment at Colleges That Award Federal Financial Aid, 2004-8
| 2008 | 2007 | 2004 | 1-Year Change | 4-Year Change | |
| Total | 19,574,395 | 18,670,775 | 17,710,798 | 4.84% | 10.52% |
| --Public | 14,092,109 | 13,595,540 | 13,081,358 | 3.65% | 7.73% |
| --Private | 3,684,723 | 3,595,207 | 3,440,559 | 2.49% | 7.10% |
| --For-profit | 1,797,563 | 1,480,028 | 1,188,881 | 21.45% | 51.20% |
| 4-year colleges | 12,131,855 | 11,630,585 | 10,726,683 | 4.31% | 13.10% |
| --Undergraduate | 9,394,747 | 8,986,267 | 8,235,301 | 4.55% | 14.08% |
| ----Public | 5,951,146 | 5,813,773 | 5,407,236 | 2.36% | 10.06% |
| ----Private | 2,501,295 | 2,436,958 | 2,347,309 | 2.64% | 6.56% |
| ----For-profit | 942,306 | 735,536 | 480,756 | 28.11% | 96.01% |
| --Graduate* | 2,482,941 | 2,293,554 | 2,156,853 | 8.26% | 15.12% |
| ----Public | 1,272,612 | 1,210,278 | 1,193,584 | 5.15% | 6.62% |
| ----Private | 982,898 | 895,197 | 825,093 | 9.80% | 19.13% |
| ----For-profit | 227,431 | 188,079 | 138,176 | 20.92% | 64.60% |
| --First professional* | 254,167 | 350,764 | 334,529 | -27.54% | -24.02% |
| 2-year colleges | 7,100,631 | 6,740,309 | 6,656,105 | 5.35% | 6.68% |
| --Public | 6,693,185 | 6,374,245 | 6,282,576 | 5.00% | 6.54% |
| --Private | 46,355 | 44,843 | 56,705 | 3.37% | -18.25% |
| --For-profit | 361,091 | 321,221 | 316,824 | 12.41% | 13.97% |
| Less than 2 year | 341,909 | 299,881 | 328,010 | 14.01% | 4.24% |
| --Public | 67,075 | 54,598 | 62,206 | 22.85% | 7.83% |
| --Private | 11,821 | 12,349 | 14,005 | -4.28% | -15.59% |
| --For-profit | 263,013 | 232,934 | 251,799 | 12.91% | 4.45% |
*NCES is phasing out its use of the "first professional" category. In 2008-9, about 10 percent of institutions used the new categories, partially explaining both the drop in first professional students and the increase in graduate enrollments.
The proportion of students enrolled part time continued to grow, and grew fastest at four-year institutions, though part-time students remained more than twice as likely to be enrolled at two-year colleges as at four-year universities, as seen below:
Enrollment by Institution Type and Student Status
| 2008 | 2007 | 2004 | 1-Year Change | 4-Year Change | |
| 4-year undergraduate | |||||
| --Full time | 7,422,934 | 7,148,604 | 6,601,064 | 3.84% | 12.45% |
| --Part time | 1,971,813 | 1,837,663 | 1,634,237 | 7.30% | 20.66% |
| Graduate | |||||
| --Full time | 1,260,786 | 1,112,532 | 1,024,505 | 13.33% | 23.06% |
| --Part time | 1,222,155 | 1,181,022 | 1,132,348 | 3.48% | 7.93% |
| First professional | |||||
| --Full time | 232,245 | 316,549 | 301,543 | -26.63% | -22.98% |
| --Part time | 21,922 | 34,215 | 32,986 | -35.93% | -33.54% |
| 2-year | |||||
| --Full time | 2,934,713 | 2,789,393 | 2,773,407 | 5.21% | 5.82% |
| --Part time | 4,165,918 | 3,950,916 | 3,882,405 | 5.44% | 7.30% |
| Less than 2 year | |||||
| --Full time | 274,748 | 239,241 | 266,633 | 14.84% | 3.04% |
| --Part time | 67,161 | 60,640 | 61,377 | 10.75% | 9.42% |
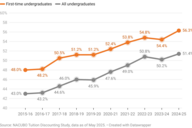
The financial aid data in the report come from 2007-8, lagging the enrollment numbers by a bit. But they reflect the fact that the economy had already turned downward by then, as they show that 2,225,061, or 76.4 percent, of the 2,910,614 full-time, first-time undergraduates enrolling that year received financial aid, up from 73.4 percent in 2006-7. The uptick occurred at all types of institutions, though the biggest change appeared at for-profit colleges.
Graduation Rates
The federal method for calculating graduation rates is widely seen as flawed and incomplete, for reasons too numerous to list (chief among them: it counts only full-time, first-time freshmen, and excludes students who transfer to another institution, even if they go on to graduate). There is general consensus that a more accurate and complete rate will require more or less blowing up the Integrated Postsecondary Education Data System, a long-term project. In the meantime, policy makers have been making small adjustments to try to make the existing rate more useful.
One such change rolled out this year extends the period over which students are tracked, to cover twice the "normal" length of the degree or certificate program (e.g., eight years for a bachelor's degree, four years for an associate degree). The change does not deal with other limitations, such as the fact that it still covers only full-timers and that students cannot be tracked across institutions. The results can be found in the table below:
Graduation Rates of Students From Original Institution, By Degree and Institution Type
| Total | Public | Private Nonprofit | Private For-Profit | |
| Bachelor's | ||||
| 100% of Normal Time | 36.1% | 28.9% | 50.3% | 26.8% |
| 150% of Normal Time | 57.5% | 54.8% | 64.4% | 33.9% |
| 200% of Normal Time | 60.6% | 58.3% | 66.4% | 37.8% |
| Degree or Certificate, 2-Year | ||||
| 100% of Normal Time | 18.9% | 11.5% | 41.9% | 42.1% |
| 150% of Normal Time | 31.4% | 22.0% | 53.5% | 61.3% |
| 200% of Normal Time | 37.3% | 28.4% | 58.1% | 65.4% |
| Certificate, Less Than 2-Year | ||||
| 100% of Normal Time | 47.3% | 57.4% | 54.2% | 45.8% |
| 150% of Normal Time | 67.0% | 71.4% | 73.8% | 66.2% |
| 200% of Normal Time | 71.5% | 80.1% | 80.0% | 70.1% |
The financial data in the Education Department report are far too broad and early (from June 2008) to paint a clear picture of how the economic meltdown is affecting higher education. But the information suggests some early signs of distress and some areas to watch.
Public four-year colleges saw the money they took in from state appropriations rise to $52.4 billion in fiscal 2008 from $48.4 billion (of a total of $213.1 billion) in 2007. But the difference between their total revenues and expenses (please don't call it profit) fell from $24.5 billion in 2007 to less than $8 billion in 2008, as their expenses soared to $207.7 billion from $188.9 billion. The additional spending was spread across many budget categories, with the biggest differences including instructional costs (presumably tied to the expanding enrollments), academic support, and "institutional support," which the government defines as day-to-day operating support. One other big-ticket change: $4.2 billion in "other nonoperating expenses and deductions."
Private four-year colleges saw their financial picture change, but more because of decreased revenues than increased costs. In fiscal 2007, the institutions collectively had revenues of $182 billion and expenses of $124 billion, a $58 billion difference. In fiscal year 2008, the figures were $138.8 billion and $133 billion. The revenue gap is almost entirely attributable to the huge drop in the value of their investments, which accounted for 30.7 percent of their revenues ($55.9 billion) in 2007 and just 4.7 percent ($6.5 billion) in 2008.