You have /5 articles left.
Sign up for a free account or log in.

2017 NACUBO-Commonfund Study of Endowments
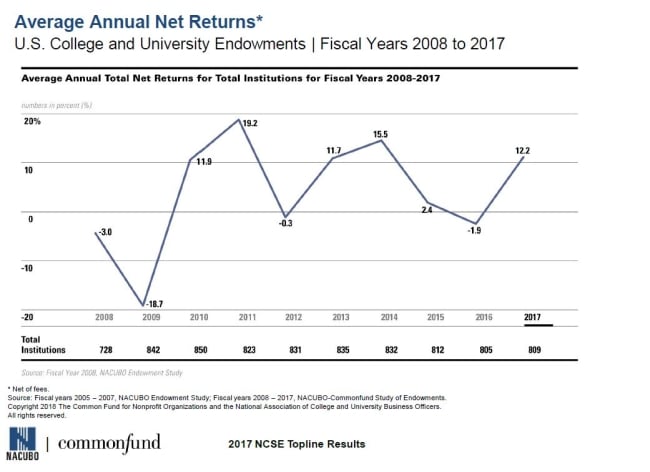
College and university endowment returns rose to their highest level in three years in the fiscal year ending June 2017, rebounding from a down prior year to average 12.2 percent, net of fees.
It was the highest average net return since fiscal 2014, when returns averaged 15.5 percent, according to an annual study released today from the National Association of College and University Business Officers and asset management firm Commonfund. In 2016, returns dipped below zero to average -1.9 percent. They were also relatively low in 2015, averaging 2.4 percent.
Net endowment returns are closely watched because the amount of money an endowment earns significantly influences its ability to provide funding for college and university operations in the future. Endowments are not intended to be checking accounts institutions draw down over time. They are considered permanent investments generating earnings that can be put toward spending priorities like research, salaries or student financial aid.
Therefore, endowment returns over time are closely tracked. The latest data show the 10-year average annual return dropping to 4.6 percent in 2017, down from 5 percent in 2016. The 10-year measure’s decline comes despite the upswing in 2017 returns, because an even higher return of 17.2 percent in 2007 fell out of the trailing average.
Most colleges and universities target long-term return rates of between 7 percent and 8 percent in order to balance earnings, inflation and spending over time.
“As long-term investors, you don’t just look at a year, you look at a decade,” Catherine M. Keating, Commonfund president and CEO, said during a conference call to discuss the study results. “It was a weaker decade.”
A mixed picture develops when looking at trailing returns over shorter time periods. The average trailing five-year return rose to 7.9 percent in this year's survey from 5.4 percent last year as a slightly negative return from 2012 dropped from the equation. Trailing three-year returns slipped to 4.2 percent this year from 5.2 percent last year because of the low returns in the previous two years.
The long-term results continue to show the effects of the financial crisis, Keating said. They also reflect a significant amount of volatility, with five years of double-digit returns in the last decade but also four years of negative or flat returns.
“When we look at returns this year, it’s really a tale of time periods,” said Keith Luke, managing director at Commonfund. “One-year returns look very good. Three-year returns actually were worse this year versus the prior period. Five-year returns look better, and 10-year returns -- which is really one of the most important areas to look at -- they were down as well.”
Strong performance across nearly every asset category drove the uptick in returns in 2017. Non-U.S. equities surged from an average return of -7.8 percent last year to post this year's highest return of 20.2 percent. U.S. equities followed suit, jumping from -0.2 percent last year to 17.6 percent. Alternative strategies rose from -1.4 percent to 7.8 percent, and short-term cash, securities and other investments inched up from 0.2 percent to 1.4 percent.
Only fixed-income returns fell, slipping to 2.4 percent in 2017 from 3.6 percent the previous year.
Within the diverse investment category of alternative strategies, every subcategory performed better in 2017 than in 2016. Returns still varied significantly, however.
Private equities generated the largest 2017 returns, 11.7 percent. Distressed debt returns came in at 8.9 percent, and venture capital returns came in at 8.4 percent. Marketable alternative strategies like hedge funds returned 7.6 percent. Private-equity noncampus real estate returned 7.3 percent, as did energy and natural resources. Commodities and managed futures, meanwhile, performed more poorly, notching returns of -2.5 percent.
But the lagging performance for fixed-income and short-term investments contributed to differences in returns for endowments of different sizes. Smaller endowments tend to invest more in fixed income and hold relatively more cash than do larger endowments. Not surprisingly, smaller endowments posted lower returns in 2017, although the spread between large and small endowment returns was a narrow 1.3 percentage points.
Endowments of less than $25 million posted an average net annual return of 11.6 percent. Larger endowments posted consistently larger returns, all the way up to the largest endowment class surveyed, those of more than $1 billion. Such large endowments returned 12.9 percent.
But the differences in returns tended to smooth out over time, likely because safer investments like fixed income are not as volatile as equities and alternative investments. The largest and smallest endowment classes recorded the same 10-year net annualized return, 5 percent. Endowments of all other sizes returned between 4.4 percent and 4.6 percent over the decade.
| Endowment value over $1B | $501M-$1B | $101M-$500M | $51M-$100M | $25M-$50M | Under $25M | |
|---|---|---|---|---|---|---|
| 1-year return (average, percent) | 12.9 | 12.7 | 12.5 | 11.9 | 11.7 | 11.6 |
| 3-year return (average, percent) | 5.0 | 4.2 | 4.1 | 3.9 | 4.0 | 4.7 |
| 5-year return (average, percent) | 8.6 | 8.1 | 7.8 | 7.7 | 7.7 | 8.1 |
| 10-year return (average, percent) | 5.0 | 4.6 | 4.4 | 4.4 | 4.5 | 5.0 |
Asset allocations were virtually unchanged over the year across institutions on all sizes. Institutions held 16 percent of assets in U.S. equities, 8 percent in fixed income, 20 percent in non-U.S. equities, 52 percent in alternative strategies and 4 percent in short-term securities, cash and other investments. The only change from 2016 was a single-point shift from alternative strategies to non-U.S. equities.
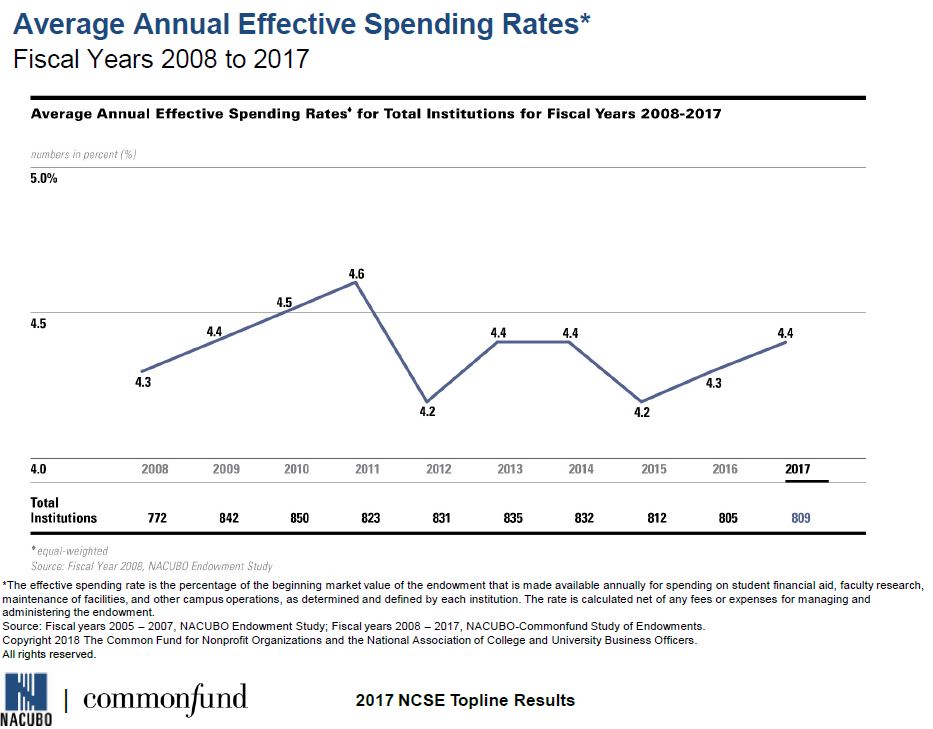
Spending rates ticked up slightly in 2017, with the effective spending rate, net of fees, averaging 4.4 percent. That was up from 4.3 percent in 2016 and the third straight year of increase.
Institutions with the largest endowments, more than $1 billion, posted the highest effective spending rate, 4.8 percent. The rate at such institutions was up from 4.4 percent the previous year.
| Over $1B | $501M-$1B | $101M-$500M | $51M-$100M | $25M-$50M | Under $25M | |
|---|---|---|---|---|---|---|
| Average Effective 2017 spending rate (percent) | 4.8 | 4.6 | 4.5 | 4.5 | 4.2 | 4.0 |
Almost two-thirds of institutions, 65 percent, said they increased endowment spending in dollar terms. The median increase reported among that group was 6.5 percent. Another 26 percent said they decreased spending dollars, with the median decrease being 6.4 percent. The remaining respondents did not answer the question or reported not changing their spending.
Relatively fewer institutions with smaller endowments reported increasing spending dollars, and relatively more institutions with smaller endowments said they decreased spending dollars. For instance, 56 percent of institutions with endowments under $25 million reported increasing spending, compared to 76 percent of those with endowments over $1 billion. And 32 percent of institutions with endowments under $25 million reported decreasing spending, compared to 13 percent of those with more than $1 billion.
Smaller institutions were more likely to report larger swings in spending as well. Institutions with endowments of less than $25 million increased spending by a median of 13.8 percent and decreased it by a median of 23.5 percent. That compares to a median increase of 6.4 percent and a median decrease of 3.7 percent among institutions with endowments of more than $1 billion.
Those findings are consistent with past survey years, said Ken Redd, NACUBO senior director of research and policy analysis. He suspects that a set of institutions with small endowments consistently increase or decrease spending dollars.
That would make sense, given that institutions with small endowments are more exposed to fluctuations in endowment size. But it's also likely those institutions are small and face significant financial pressures.
The study also examined institutional debt, finding that wealthy institutions drove down their debt levels significantly in 2017. A total of 584 out of 809 study participants reported holding debt. Those that held debt reported total debt averaging $208.1 million as of June 30, 2017, down from $230.2 million the previous year. Institutions with assets of more than $1 billion powered the drop by reducing their debt levels sharply.
Impact From Washington
Endowments have been in the spotlight of late, particularly since the passage of the tax reform package in December. Fund-raisers worry an increase in the standard deduction is removing an incentive for donors to give to colleges and universities. Financial officers and investment managers have been vocally against a new 1.4 percent excise tax on net investment income at private colleges and universities with at least 500 students and assets of $500,000 or more per student. It’s still not clear exactly how many institutions will be affected by the legislation, but estimates range from about 30 within five years to as many as 80 in 15 years.
That might seem like a tax affecting a relatively small number of wealthy institutions, but officials worry that it will cut into the amount colleges and universities can draw from their endowments to fund institutional operations. They also worry the tax could be expanded.
“My concern going forward is that there will be efforts to change the law again to increase the number of institutions that would be subjected to that excise tax,” said John Walda, NACUBO president and CEO. “We don’t want that to happen.”
The 809 institutions in this year’s study reported endowment assets totaling $566.8 billion. The median endowment weighed in at $127.8 million, and 44 percent of endowments were valued at $100 million or less.
Below are the 25 largest endowments in the country and their change in size between 2016 and 2017. Please note that the change in market value is not a rate of return but includes investment gains and losses, donor gifts, fees, and withdrawals to fund expenses.
| Institution | 2017 Endowment Funds (in $1,000s) | 2016 Endowment Funds (in $1,000s) |
Change in Market Value (percent) |
|---|---|---|---|
| Harvard University | $36,021,516 | $34,541,893 | 4.3 |
| Yale University | 27,176,100 | 25,408,600 | 7.0 |
| University of Texas System | 26,535,095 | 24,203,213 | 9.6 |
| Stanford University | 24,784,943 | 22,398,130 | 10.7 |
| Princeton University | 23,812,241 | 22,152,580 | 7.5 |
| Massachusetts Institute of Technology | 14,967,983 | 13,433,036 | 11.4 |
| University of Pennsylvania | 12,213,202 | 10,715,364 | 14.0 |
| Texas A&M University System and Foundations | 11,556,260 | 10,539,526 | 9.6 |
| University of Michigan | 10,936,014 | 9,743,461 | 12.2 |
| Northwestern University | 10,436,692 | 9,648,497 | 8.2 |
| Columbia University | 9,996,596 | 9,041,027 | 10.6 |
| University of California | 9,787,627 | 8,341,073 | 17.3 |
| University of Notre Dame | 9,352,376 | 8,374,083 | 11.7 |
| Duke University | 7,911,175 | 6,839,780 | 15.7 |
| Washington University in St. Louis | 7,860,774 | 7,056,593 | 11.4 |
| The University of Chicago | 7,523,720 | 7,001,204 | 7.5 |
| Emory University | 6,905,465 | 6,401,650 | 7.9 |
| Cornell University | 6,757,750 | 5,972,343 | 13.2 |
| University of Virginia | 6,393,561 | 5,852,309 | 9.2 |
| Rice University | 5,814,444 | 5,324,289 | 9.2 |
| University of Southern California | 5,128,459 | 4,608,717 | 11.3 |
| Dartmouth College | 4,956,494 | 4,474,404 | 10.8 |
| Ohio State University | 4,253,459 | 3,578,562 | 18.9 |
| Vanderbilt University | 4,136,465 | 3,795,586 | 9.0 |
| New York University | 3,991,638 | 3,487,702 | 14.5 |


