You have /5 articles left.
Sign up for a free account or log in.
2020 NACUBO-TIAA Study of Endowments
Colleges and universities spent more from their endowments during a fiscal year that ended amid the pandemic despite recording lower-than-average returns, according to the latest annual study of endowments from the National Association of College and University Business Officers.
The study, released today, provides a detailed look at college and university endowments' investment and spending during fiscal year 2020, which began July 1, 2019 and ended June 30, 2020. The association surveyed 705 institutions for this year’s study. Together they represent a combined $637.7 billion in endowment assets. Surveyed institutions reported an average endowment size of $905 million, up 1.6 percent from fiscal year 2019. The median endowment size was only $164.6 million in fiscal year 2020, indicating that a small number of very large endowments skewed the overall average upward. Nearly half of surveyed college and university endowments are under $140 million.
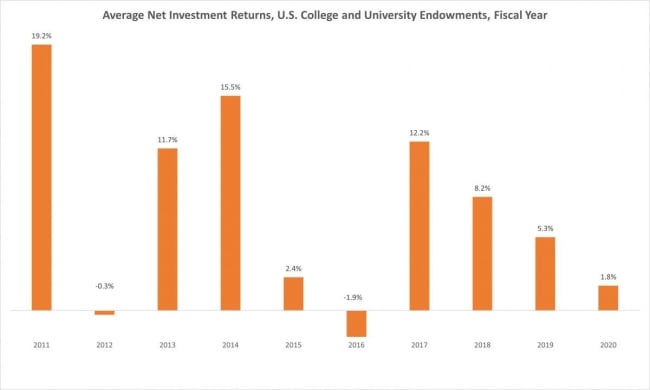
College endowment returns averaged 1.8 percent in fiscal year 2020. The average rate of return was considerably lower than last year’s 5.3 percent and falls sharply below the historical target rate of 7.5 percent.
It was the lowest average annual return since 2016. That year, endowment returns averaged -1.9 percent, meaning 2020 returns still outpaced recent lows.
Things could have been worse. When NACUBO surveyed institutions about their endowments as markets staggered in March and April of last year, the average endowment was down more than 20 percent, according to Ken Redd, senior director of research and policy analysis at NACUBO.
Even with fiscal 2020's subpar returns, colleges and universities are still tracking at a 7.5 percent average rate of return across 10 years, according to the study. But averages across other time frames miss the historical target: five-year annualized returns came in at 5.1 percent, 15-year annualized returns were 6.2 percent and 20-year annualized returns were 5.5 percent.
Private college and university endowments performed slightly better than public institutions' in fiscal year 2020. Private institutions saw an average 2 percent return last year, while public institutions averaged 1.5 percent. To break down further the different arrangements public institutions use to invest, public college, university and system endowments saw a 1.4 percent average rate of return, institution-related foundations averaged 1.7 percent and combined endowment/foundations averaged 1.2 percent.
Surveyed institutions spent a collective $23.3 billion from their endowments during fiscal year 2020. Seven in 10 institutions increased their spending last year, with an average spending increase of $3.3 million over the previous year.
Endowments between $51 million and $100 million averaged a 5 percent spending rate in fiscal year 2020, the highest spending rate of any endowment size. Endowments below $25 million averaged a 4.1 percent spending rate, and endowments greater than $1 billion averaged 4.5 percent.
The largest chunk of endowment spending -- 48 percent -- paid for financial aid to students. Another 17 percent funded academics, which includes teaching, tutoring and related support, according to the study.
Nearly half of surveyed institutions upped their endowment spending during the pandemic to support their operating budgets. More than 40 percent of institutions reported cash flow declines in fiscal year 2020, and new gifting to endowments fell by 16 percent.
After an initial panic in the spring, the U.S. stock market recovered its losses by the end of fiscal year 2020. Endowments recovered less than major stock indexes primarily because they are invested in a broad array of asset classes -- from bonds and real estate to private equity and venture capital.
“Not all of those markets were rallying as strongly as U.S. public markets,” Redd said. “That’s one reason why endowments may not have had as strong a rally.”
|
Endowment Size |
U.S. Equities |
Non-U.S. Equities |
Global Equities |
Mark. Alts. |
Private VC | Private Equity | Fixed Income | Real Assets |
|---|---|---|---|---|---|---|---|---|
| Over $1 billion | 10 | 13 | 7 | 21 | 15 | 11 | 11 | 13 |
| $501 million to $1 billion | 22 | 16 | 5 | 17 | 11 | 5 | 15 | 9 |
|
$251 million to $500 million |
20 | 15 | 9 | 18 | 10 | 3 | 17 | 8 |
| $101 million to $250 million | 29 | 15 | 8 | 13 | 6 | 2 | 20 | 7 |
| $51 million to $100 million | 31 | 14 | 9 | 9 | 5 | 1 | 25 | 6 |
| $25 million to $50 million | 38 | 14 | 6 | 6 | 2 | <1 | 29 | 5 |
| Under $25 million | 42 | 12 | 5 | 4 | 2 | <1 | 31 | 3 |
Small endowments are more concentrated in fixed-income assets, such as bonds, according to the study. About a third of investments held in small endowments, which hold $50 million or less, are fixed income, and around 40 percent are invested in U.S. equities. Small endowments invest less than 1 percent of their value in private equity.
By comparison, large endowments holding $500 million or more invest between 11 percent and 15 percent in fixed-income assets and put between 5 percent and 11 percent in private equity. Large endowments also invest between 17 percent and 21 percent in marketable alternatives, which NACUBO defines as "hedge funds, absolute return, market neutral, long/short, 130/30, and event-driven and derivatives" strategies.
This year, small endowments had roughly the same rate of return as large endowments. Endowments under $25 million and endowments over $1 billion both saw 2.5 percent average rates of return in fiscal year 2020.
But small endowments’ long-term returns are low by comparison. Endowments under $25 million average a 7.5 percent rate of return over 10 years, while endowments over $1 billion are looking at a 7.9 percent average rate of return in the same time period.
“Over the 10-year period, larger endowments did enjoy a stronger gain than the smallest endowments. That’s where the concentration in fixed income really does play a role,” Redd said. “Over the long term, endowments that are invested in private equity and venture capital tend to do better than stocks and bonds.”
Despite fiscal year 2020’s low average returns, Redd doesn’t think institutions will change their investment strategies in the wake of the pandemic. Adjustments to endowment management happen very slowly.
“In the past, when we’ve had market downturns, we’ve seen endowment investors by and large keep to their strategies because they don’t want to time the market. They don’t want to chase performance in the short term,” Redd said. “Having said that, the returns this year were quite low. There may be a greater push among some campuses to examine their asset allocations and try to figure out if there are adjustments they can make to get better long-term performance.”
Diversity and ESG Policies
For the first time, the survey asked institutions if they had a formal diversity policy in place for asset management. Of the 705 institutions surveyed, 642 answered the question, and 6 percent said they had formal policies related to diversity in asset manager selection.
The largest endowments were more likely to have a formal diversity policy in place, according to the survey. Justin Wilson, director of the Diverse Asset Managers Initiative, suspects this is because the managers of large endowments have more control over their investment strategies.
“There’s often a belief that the managers of large endowments have grown those endowments, and they’re given a lot more leeway by their institutions,” Wilson said. “So if they want to put a diverse manager program in place, they can.”
Although 6 percent is low, Redd noted that the survey question only asked about formal diversity policies. It’s possible institutions are hiring women and people of color to manage their endowments without a policy requiring them to do so.
Wilson is skeptical of this idea. According to the Knight Foundation, women and minority-owned firms manage only 1.3 percent of the $69 trillion asset management industry. Without a formal diversity policy in place, colleges aren’t held accountable and often don’t hire women and people of color to manage their endowments, he said.
“Don’t tell me what the world of the possible is. Tell me what you are doing,” Wilson said. “When people tell us about what they can and can’t do, it leaves a lot of room for, ‘Just trust me, I know what I’m talking about.’ I think that has led to a lot of the exclusion that we’ve seen over the years.”
NACUBO also asked institutions about environmental, social and governance, or ESG, policies. Four in five institutions said that ESG factors are reflected in their investment policies. About 19 percent of endowments include responsible investing criteria in their public equity portfolios. About 16 percent do so for global equities.
Historically, endowment managers feared that prioritizing responsible investing could lead to lower returns. Only 19 percent of institutions said they believe responsible investing can deliver performance that is better than average market returns.
Twenty-Five Largest Endowment Values
Below are the 25 largest college and university endowments in the country and their changes in size between the 2020 and 2019 fiscal years. Change in size is not the rate of return referenced throughout this article. It includes several additional factors that can affect endowment size in additional to investment gains and losses: withdrawals, gifts and contributions, and management and investment fees.
| Institution | 2020 Endowment Funds (in $1,000s) | 2019 Endowment Funds (in $1,000s) | Change in Market Value (percent) |
|---|---|---|---|
| Harvard University | 40,575,027 | 39,427,896 | 2.91 |
| University of Texas System | 31,958,313 | 30,958,239 | 3.23 |
| Yale University | 31,201,700 | 30,314,800 | 2.93 |
| Stanford University | 28,948,000 | 27,699,834 | 4.51 |
| Trustees of Princeton University | 26,558,642 | 26,116,022 | 1.69 |
| Massachusetts Institute of Technology | 18,495,905 | 17,569,328 | 5.27 |
| Trustees of the University of Pennsylvania | 14,877,362 | 14,649,761 | 1.55 |
| Texas A&M University System & Related Foundations | 13,594,481 | 13,514,527 | 0.59 |
| University of Michigan | 12,476,874 | 12,448,816 | 0.23 |
| Regents of the University of California | 12,141,761 | 11,797,543 | 2.92 |
| University of Notre Dame | 11,962,820 | 11,268,365 | 6.16 |
| Trustees of Columbia University | 11,257,021 | 10,950,738 | 2.80 |
| Northwestern University | 10,926,510 | 11,091,516 | -1.49 |
| Duke University | 8,474,070 | 8,609,003 | -1.57 |
| Washington University | 8,420,497 | 7,953,985 | 5.87 |
| University of Chicago | 8,204,461 | 8,263,868 | -0.72 |
| Emory University | 7,936,987 | 7,872,381 | 0.82 |
| University of Virginia | 7,255,701 | 7,058,234 | 2.80 |
| Cornell University | 7,218,687 | 7,328,241 | -1.49 |
| Vanderbilt University | 6,917,370 | 6,270,876 | 10.31 |
| Johns Hopkins University | 6,750,092 | 6,275,939 | 7.56 |
| Rice University | 6,163,926 | 6,481,102 | -4.89 |
| Dartmouth College | 5,975,180 | 5,731,322 | 4.25 |
| University of Southern California | 5,914,358 | 5,732,100 | 3.18 |
| Ohio State University | 5,287,131 | 5,256,758 | 0.58 |