You have /5 articles left.
Sign up for a free account or log in.
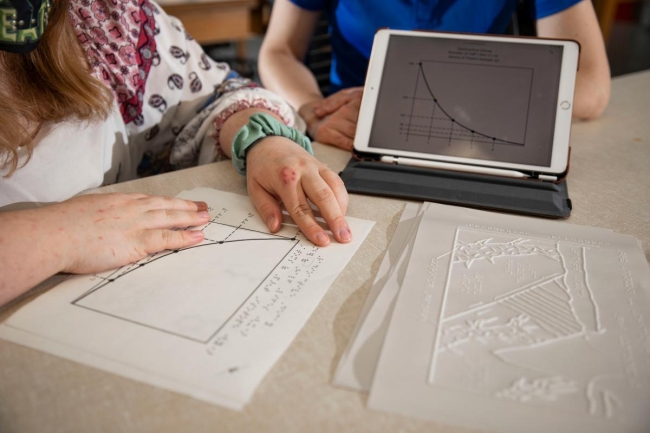
Sydney Clark reviews some of the images from a new tactile graphics repository that aims to open up geosciences to students who are visually impaired.
Pete Comparoni/University of Kentucky
When Sydney Clark, who is blind, enrolled in a geosciences class at the University of Kentucky in 2017, her professor realized the course was stacked with accessibility barriers.
In the geosciences, colorful maps, diagrams, graphs and photographs play an important role in conveying information and helping students understand new concepts, said Kent Ratajeski, senior lecturer in earth and environmental sciences. While some textbooks are compatible with screen readers for students who are visually impaired, even the accessible materials do a poor job describing complex images. It can be difficult to convey the movement of tectonic plates, explain glacial drift or describe the significance of different layers of sedimentary rock using words alone, said Ratajeski.
Knowing that geology is a very visual subject, Clark was concerned. In the past she encountered instructors who did not know how to support her. In some cases, Clark was even advised by instructors that their classes might not be a good fit for her, despite the fact that legally, all classes should be made accessible to students with disabilities.
Ratajeski met with Clark to discuss how he could support her and find out more about how she learns best. The professor realized there were few ready-made tactile resources for blind students studying geosciences and took matters into his own hands -- creating models and tactile course materials that Clark could feel with her fingertips.
After Clark graduated in 2017, Ratajeski continued that work -- creating a digital repository of tactile graphics for other students and professors to print out and use in their classes.
Tactile Graphics
Learning through touch is very important to Clark, now 25, who started learning Braille when she was 5 and became almost completely blind when she was a teenager. Throughout her K-12 education, a staff member created tactile graphics for Clark with diagrams and pictures annotated in Braille. She didn't find that same type of support in higher education.
“I was always used to having tactile graphics there,” Clark said. “When I went to college, Braille was not a thing, really.”
When she enrolled in the University of Kentucky, there was a Braille printer in the Disability Resource Center, but staff weren't sure how to use it, Clark said. Eventually, Clark became so familiar with the office that she would come and go to use the equipment without supervision.
As a public health major, Clark was required to take multiple classes in science and math. She found supportive professors and a good variety of tactile course materials in her biology and anatomy classes. But in the geosciences, there were very few accessible materials readily available.
Though she could ask someone to describe an image to her, a person with vision doesn’t necessarily know all the important pieces of an image to describe, Clark said.
“There can be a breakdown in communication sometimes,” Clark said. “Having that tactile image there really helps get everything across that needs to be understood.”
In literature searches, Ratajeski found very few articles in the geosciences describing best practices for teaching visually impaired students. The few articles he did find focused very much on the importance of creating models with textured surfaces that students can hold and explore with their hands. In response, Ratajeski started creating tactile collages and models out of clay, fabric, polystyrene foam and wax in his basement and then bringing them into class for Clark.
"I probably went a bit overboard," said Ratajeski.
Clark didn't often encounter instructors willing to go that extra mile. But when she did, she said it made her experience of the class much richer and encouraged her to work harder.
“He would go to Hobby Lobby and different craft stores and make me models of volcanoes out of clay,” Clark said.
As the semester progressed, Ratajeski learned that there are printers that can create tactile graphics using heat-activated capsule paper. He started to draw his own graphics and print them at the Disability Resource Center. On one of his trips to the center before class to print out new materials, it occurred to Ratajeski that instead of creating his own drawings, having a library of ready-made tactile graphics would be a very useful resource for instructors across the geosciences.
 “When I looked at what resources are out there, I just didn’t find too many,” Ratajeski said. “There are some tactile image libraries online, but boy, nothing much there for geology. There was a lot of biology, and some science and chemistry, but geosciences seemed to be very underrepresented.”
Through his research, Ratajeski found there are a total of six geology-related images in the Tactile Graphic Image Library housed at the American Printing House for the Blind. There are 140 images for biology, 76 for astronomy, 76 for physics and 68 for chemistry. At the Tactile Library, which is a resource primarily aimed at K-12 students, there is a similar underrepresentation of geosciences, he said.
Securing Funding
Ratajeski has not taught another visually impaired student since Clark, who has since completed a master's degree and now works as an epidemiologist. But he did not let go of the idea that a repository of ready-made tactile graphics would be a useful resource for other instructors.
Clark finished Ratajeski's class with top grades, and the professor was convinced that more visually impaired students would consider studying geosciences if they knew sufficient resources would be available for them.
Searching for grant funding to support the creation of the repository was challenging, said Ratajeski. It wasn't clear who would fund this kind of work. After more than a year of searching and applying for grants, mostly from charitable foundations, without success, Ratajeski followed a recommendation from a colleague in the university's Office of Philanthropy. He secured a $5,000 community grant from the American Geophysical Union in September 2019.
The repository of tactile graphics was published this January. Jack Reed, a software engineer who works in Stanford University's libraries, assisted with web development. Donna Lee, clinical associate professor and visual impairment program faculty chair in the University of Kentucky’s College of Education, offered her expertise in Braille and tactile graphic design. Lee’s students served as editors for the project, making sure the graphics are fully accessible. Clark served as a consultant.
The images are offered in three formats, Lee said: one with text annotations, one with Braille and one without any annotation so that students or instructors can add their own labels. To print the images, instructors will need access to a printer such as a Picture in a Flash tactile graphic maker. PIAF printers use heat on special paper that swells where there is black ink, creating a textured surface.

The printers are a worthy investment for a higher education institution and widely used in education settings, Lee said. A PIAF printer costs around $1,400, with paper ranging from around $1 per sheet to $2.50 per sheet for larger formats. Printing using the devices is quick and easy, though some care has to be taken to ensure that an image is tactually readable.
“It’s not as simple as just raising a few lines,” Lee said. Texture and the size of the materials are very important, since fingertips cannot distinguish between very fine details easily, she said.
Lee and her students also had to consider that in the geosciences, certain patterns on diagrams and maps can be symbolic. A tactile graphic using a particular texture may be very important for conveying information in the geosciences, she said. A wavy line, for example, might represent the anticline and syncline of rock folds. The movement of tectonic plates might be indicated in diagonal lines moving in different directions.
The repository is now published on the website of the International Association for Geoscience Diversity, a nonprofit organization that aims to improve access and inclusion in the geosciences for people with disabilities.
So far, more than 80 black-and-white vector graphics have been shared in the repository, covering common themes and topics in introductory geosciences courses at the high school and college levels. Ratajeski plans to keep adding to the repository over time and encourages other instructors to create similar resources.
Though Ratajeski has taught just one blind student, he does not regret any of the time or effort he spent creating tactile resources. The next time a student who is visually impaired joins his class, he’ll be ready -- and he can signal to incoming students that his class will be accessible to them.
Clark knew geology courses were visually geared when she signed up for Ratajeski's class four years ago. So she expected to have to navigate issues. But knowing resources exist can open up the subject for blind students in the future, she said.
“If I had known there was a resource like this repository, I wouldn’t have hesitated,” she said. “It opens up a lot of doors.”