You have /5 articles left.
Sign up for a free account or log in.
Getty Images: zimmytws
The National Association of Financial Aid Administrators compiles an annual report of the latest data on major federal student aid programs. The new National Student Aid Profile provides an overview of how federal student aid programs are being allocated, how much the federal government is spending on these programs, and how much each student is receiving depending on their income level.
The federal government currently offers seven main student aid programs under Title IV of the Higher Education Act of 1965. This includes direct aid programs such as the Pell Grant, the Federal Supplemental Education Opportunity Grant, and Federal Work-Study as well as student loan programs like the Federal Direct Subsidized and Unsubsidized Loans, Graduate PLUS Loans, and Parent PLUS Loans. The report is based on the most recent data from the Education Department.
Overall, in the 2020-2021 award year, the federal government awarded $26.5 billion in Pell Grants to 6.4 million students. The federal government awarded $1.2 billion in federal Supplemental Educational Opportunity Grant (FSEOG) to 1.6 million students and $1.1 billion in federal work-study to 579,000 students in award year 2019-20.
The states that were awarded the most funding for institutional federal student aid programs (FSEOG and Federal Work Study) were California, New York, Pennsylvania, and Florida. California, which received the most funding in award year 2021-2022, was awarded $108 million for FSEOG across 388 colleges and $133 million for Federal Work Study across 328 colleges.
For federal student loan programs, a total of 10.4 million borrowers received Federal Direct Loans while another 1 million received Federal Direct PLUS Loans.
The report also tracked legislation introduced in Congress related to student aid. In 2021, 101 student aid-related bills were introduced, compared to 47 in 2020 and 160 in 2019. Of the bills introduced last year, 32 percent addressed student loans and repayment, 16 percent addressed consumer information, and 13 percent addressed quality and accountability.
Pell Grants
The Pell Grant program provides grants to undergraduates based on financial need, typically determined by a student's family's estimated ability to contribute to college costs, calculated annually on the Federal Free Application for Federal Student Aid (FAFSA).
Most Pell Grants in award year 2019-2020, 41.6 percent, went to students attending public four-year colleges. In award year 2020-2021, the average Pell Grant award was $4,166, with the maximum award set at $6,195.
The maximum Pell Grant award increased by $300 between award years 2019-2020 and 2021-2022. The maximum Pell grant award is set to increase to $6,895 in fiscal year 2022-2023 given new appropriations from Congress.
According to the report, 78 percent of recipients had family incomes less than $40,000 a year.
The FSEOG is a student aid program available to undergraduates where colleges must match the funds provided by the federal government by at least 25 percent. Priority is given to students who receive Pell Grants and those with the lowest family contribution estimates.
Overall, 35.7 percent of FSEOG recipients attended public four-year colleges and received an average award of $753 in award year 2019-2020. The maximum award amount at the time was $4,000.
Between the years 2020-2021 and 2022-2023, federal appropriations for the FSEOG program rose from $880 million to $895 million.
The most common income bracket for students receiving FSEOG were those with an expected family contribution of less than $6,000, accounting for 15.9 percent of all students. These students received an average award of $826. Of students who received FSEOG and were independent of their families, 29.8 percent had incomes at or below $20,000.
Federal Work-Study>
Federal work-study is a program based on financial need where the federal government pays 75 percent of a student's wages, and the remaining 25 percent is paid by the student's employer.
The typical award amount for undergraduates in the award year 2019-20 was $1,946. Of the 579,000 recipients, 41.9 percent had families that made more than $60,000 a year. For students that are financially independent of their family, 29.4 percent had incomes less than $20,000.
Between award years 2021-2022 and 2022-2023, appropriations for federal work-study have increased from $1.19 billion to $1.21 billion. Almost half, 48.7 percent, of students who received federal work study attended private non-profit colleges, with 34.9 attending a public four-year college.
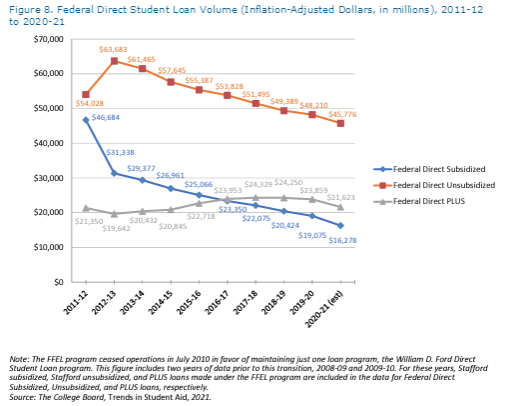
Federal Direct Student Loans
The federal government offers two direct loan programs: subsidized and unsubsidized. Under the Federal Direct Subsidized Loan program, interest is paid by the federal government while the student is in college and during any deferment period. These loans can be capped depending on a student's income. On the other hand, the Federal Direct Unsubsidized Loan program is not based on financial need and a borrower is charged interest on the loan at all times. These loans are also available to graduate students.
In the 2020-2021 award year, 4.4 million students borrowed subsidized direct loans, borrowing an average of $3,764, totaling $16.5 billion. For unsubsidized loans, there were 6 million borrowers at an average of $4,109 for undergraduate and $18,425 for graduate students, totaling $45.5 billion.
The typical adjusted gross family income was less than $20,000 for both subsidized (30.4 percent) and unsubsidized (26.1 percent) loans.
Federal PLUS Loans
The federal government offers PLUS loans to parents of college students or students in graduate programs, where they are able to borrow up to the full cost of attendance and are provided regardless of borrower income.
In award year 2020-2021, 606,559 parents took out parent PLUS loans, averaging around $16,529. Of parents who borrowed, 36.1 percent had a gross adjusted income over $100,000.
For GRAD Plus Loans, 433,602 loans were dispersed with an average borrowing amount of $26,280. Of GRAD Plus borrowers, over half, 52.8 percent, had incomes less than $20,000.
Impacts of COVID-19 on Federal Student Loan Repayment, Loan Status, and Delinquency:
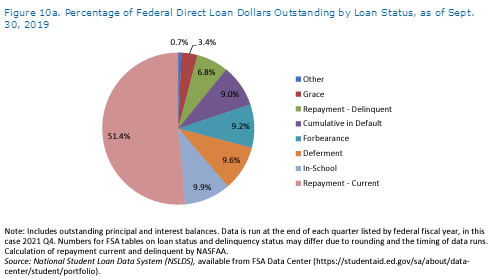
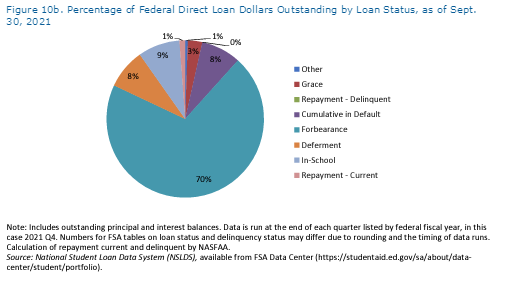
Data on the status of federal student loan borrowers differ highly from what it looked like just two years ago due to programmatic changes throughout the pandemic. First, the pause on student loan payments has changed the repayment status for much of America’s federal student loans.
Since March 2020, federal student loan borrowers have not been required to make payments on their student debt under the payment pause that has been extended multiple times by both the Trump administration and the Biden administration. Thus, between September 30, 2019, and September 30, 2021, the number of federal student loan borrowers in repayment decreased from 51.4 percent to less than 1 percent. The pause on federal student loan payments is currently set to expire on August 31.
An additional change implemented during the pandemic was the PSLF Waiver, a temporary program set to expire on October 31 of 2022 that streamlined the process to apply for PSLF. The program provides debt forgiveness to eligible public service employees who work for 10 years or make 120 qualifying payments.
Since the waiver was created in 2021, borrowers that have been approved for PSLF have increased dramatically. In the last quarter of 2020, just over 5,000 had been approved for forgiveness under PSLF, compared to 756,000 that were approved in the first quarter of 2021.
The average balance discharge for PSLF in 2022 was $97,216.