You have /5 articles left.
Sign up for a free account or log in.
The National Collegiate Athletic Association’s Division I men’s basketball tournament is one of the country’s major spectacles, featuring scores of games, hundreds of millions of television viewers and untold numbers of thrills and heartbreaks.
Since 2006, Inside Higher Ed has tried to do its small part to contribute, with this, our annual Academic Performance Tournament. Unlike traditional NCAA brackets, ours determines the winners of each game by comparing the academic performance of teams, as measured by the NCAA’s own imperfect metrics for judging academic success.
We first match the teams based on the academic progress rate, the NCAA’s multiyear measure of a team’s academic performance. Among other things, the APR excludes athletes who leave in good academic standing, so powerhouse programs where players tend to go pro early can still fare well on the measure. The NCAA did not publish APR data during the pandemic, but this year’s bracket uses the first new data the NCAA has published since then, covering the 2020–21 academic year.
When two teams matched up for a game in the bracket tie going head to head on the APR, we turn to the NCAA’s graduation success rate for 2021–22, which measures the proportion of athletes who graduated within six years of entering the institution. The graduation success rate also excludes athletes who leave the institution in good academic standing and credits programs for players who transfer in and go on to graduate from the institution. As a result, the rates on average are significantly higher than the federal graduation rate, the formula the federal government uses to track graduation rates for all students.
We use the federal graduation rate if two matched-up teams have identical scores on both the APR and the graduation success rate, as happened several times in this year’s bracket.
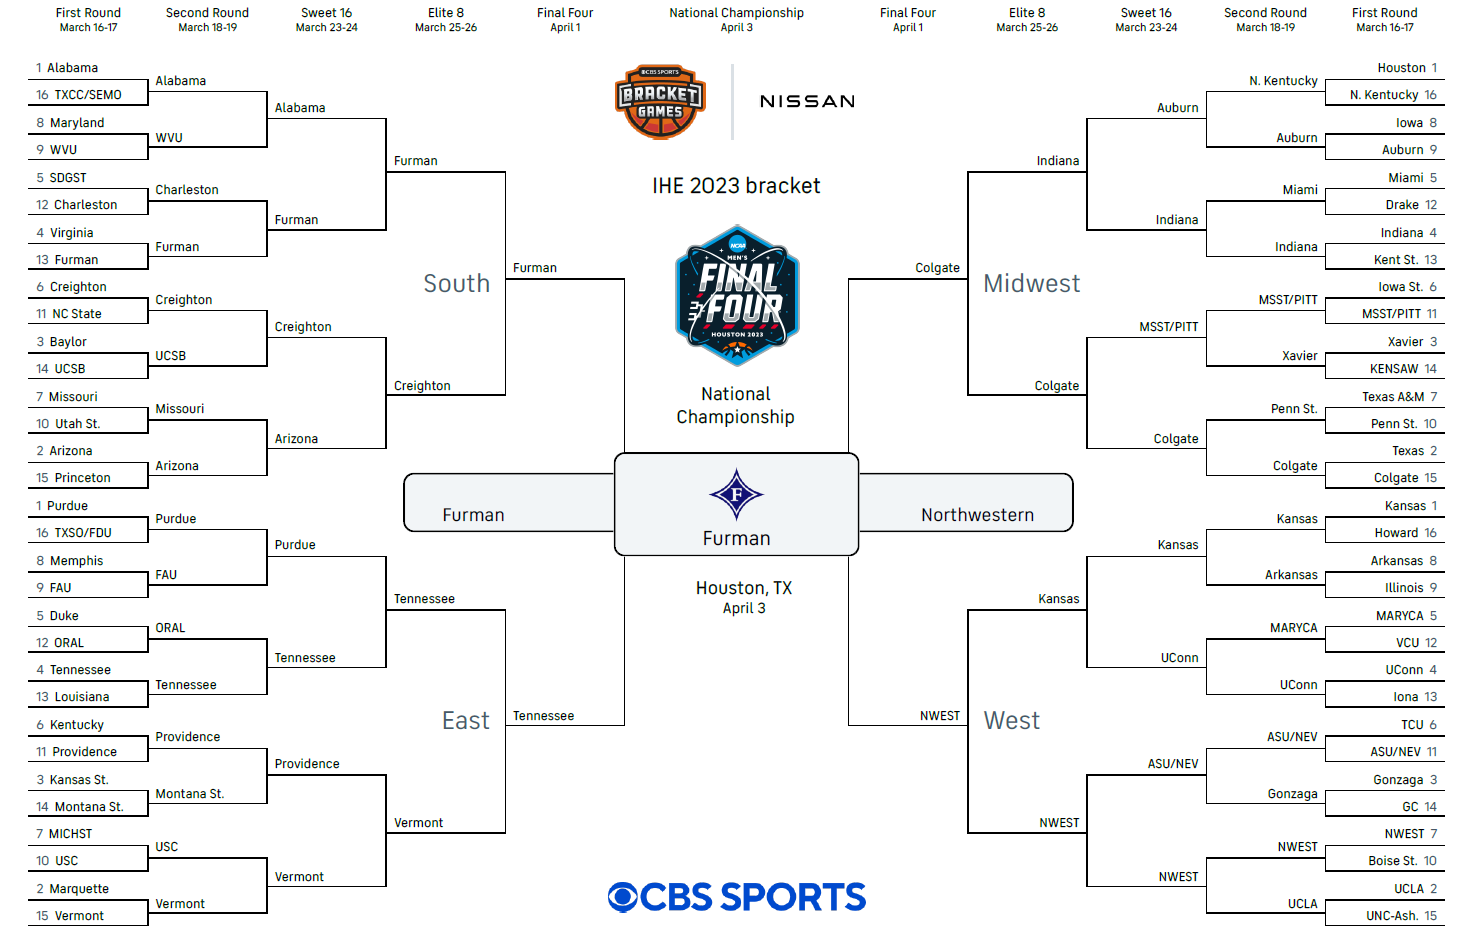
Below is Inside Higher Ed’s 2023 Academic Performance Tournament bracket.
Go Paladins.


