You have /5 articles left.
Sign up for a free account or log in.
ACT scores are up this year, but the scores of black and Latino students and those who did not complete recommended college preparatory courses remain far behind those of other students.
Data released today cover those who graduated from high school this year, many of whom are now enrolling in college. The College Board releases data on SAT score a little later than the ACT does, and so those statistics are not yet available.
This year the average composite score on the ACT was 21.0, up from 20.8 a year ago. (The maximum score on each part of the exam, and on the composite, is 36.)
Last year, ACT officials attributed a decline of 0.2 points in the composition score to a large increase in the number of students taking the ACT. Generally, such increases, often associated with states requiring test taking, bring in many who may not be prepared for college-level work or a test of one's potential for college-level work. This year, ACT reported a slight decline in the number of test takers.
Average ACT Scores, 2013-17
| Year | English | Mathematics | Reading | Science | Composite |
| 2013 | 20.2 | 20.9 | 21.1 | 20.7 | 20.9 |
| 2014 | 20.3 | 20.9 | 21.3 | 20.8 | 21.0 |
| 2015 | 20.4 | 20.8 | 21.4 | 20.9 | 21.0 |
| 2016 | 20.1 | 20.6 | 21.3 | 20.8 | 20.8 |
| 2017 | 20.3 | 20.7 | 21.4 | 21.0 | 21.0 |
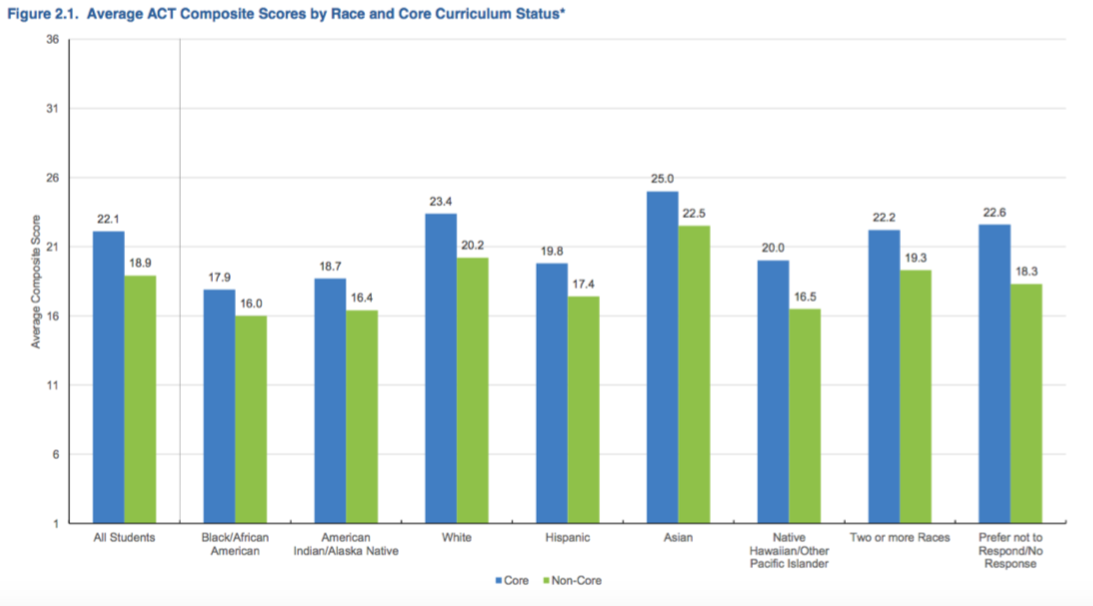
A major theme of the ACT's annual reports is that preparation is key to doing well on the exams, and that significant gaps exist based on wealth, race and other factors.
For example, ACT defines "underserved" students (who represent 46 percent of those who took the test) as students who would be first generation in their family to attend college, who come from low-income families or who are from a minority race or ethnicity.
Of those who match all three of those criteria, only 9 percent showed "strong readiness" for college-level work, based on course preparation and ACT scores.
This year's data show large gaps by race and ethnicity, although members of all racial and ethnic groups perform better on the ACT if they took core courses in high school to prepare for college. Still, Asian students who did not take core courses did better on the ACT than black and Latino students who did take core courses.