You have /5 articles left.
Sign up for a free account or log in.

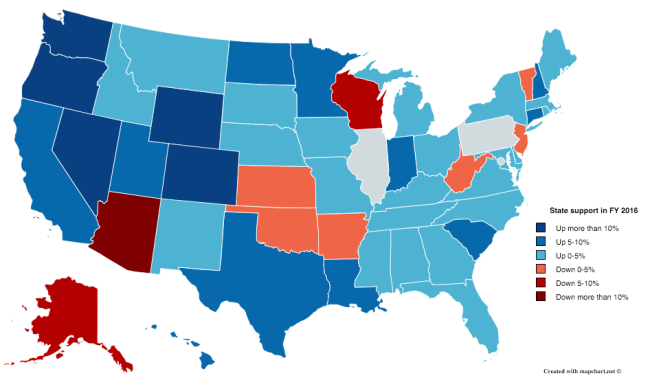
Funding for higher education from fiscal year 2015 to 2016
Data: Grapevine
State support for higher education is up 4.1 percent this year, according to a new report.
The Grapevine report, released today, shows a slow but steady increase in state funding over the last few years. Between the 2015 and 2016 fiscal years, 39 states reported increases in state funding, while only nine reported decreases.
The remaining two states -- Illinois and Pennsylvania -- have yet to finalize their budgets and are not included in the report. Once those data become available, the national averages could change significantly, given the two states' size and significance.
The report, conducted annually by the Center for the Study of Education Policy at Illinois State University and the State Higher Education Executive Officers, compares state spending from the current fiscal year to spending in past years. It includes state appropriations -- money set aside for operating support for colleges and universities, financial aid, and state scholarships, among other things -- but doesn’t include money from student fees or most federal sources.
It also doesn't take enrollment increases into account, which means the results don't reflect how much money states spend on each student.
This year’s report marks the third consecutive year that state support has increased. State funding went down by 7.6 percent back in 2012 -- the largest decline in at least the last half century -- and in 2013, it went down by just 0.4 percent. Since then, it’s gone up every year.
“Many states are experiencing an ongoing but slow recovery from the losses of the last recession,” said James Palmer, a professor at Illinois State and author of the report. “State support for higher education pretty much tracks the ups and downs of the business cycle of the economy.”
The numbers reflect patterns that researchers have observed since the Grapevine project began back in 1961, Palmer said. Recessions are often followed by a period of retrenchment -- and then when the economy starts to pick up, funding begins to recover.
That’s where the states are now, according to Palmer, and the data from the last five years support his conclusion. Including federal stimulus money allocated to higher education in the years following the recession, 15 states spent less money on higher education in 2016 than they did in 2011. And if that number seems high, it’s important to compare it to last year’s data: In 2015, half of states spent less on higher education than they did in 2010.
But even so, firm conclusions can't be drawn until the Illinois and Pennsylvania data come in.
“This is the first time in the 15 years that I’ve been working with Grapevine in which we’ve had states that weren’t able to report figures by now,” Palmer said. “If they eventually weigh in with decreases between fiscal year 2015 and fiscal year 2016, that national increase would go down.”
Illinois increased its funding 21.1 percent between fiscal years 2014 and 2015 -- more than any other state. Most of that money, however, went to public employee retirement plans, not classrooms. And now, in the midst of a budget impasse, universities are covering the cost of 125,000 students’ Monetary Award Program grants, which are meant to be covered by the state. Pennsylvania, meanwhile, is facing the longest budget stalemate in modern state history.
And even though the current national average shows a modest increase in state support, the numbers vary widely from state to state. Increases range from 0.1 percent in Kentucky to 16.2 percent in Oregon, while decreases range from 0.1 percent in New Jersey to 14 percent in Arizona.
Arizona’s been struggling for a while. Since the recession, Arizona has decreased state funding and increased tuition more than any other state, according to the Center on Budget and Policy Priorities. Back in March, the state moved to pull all funding from two of its largest community college districts. And earlier this month, when the think tank Young Invincibles graded states on their support for public higher education, Arizona received an F.
On the other side of the spectrum, the increased spending in Oregon follows years of deep budget cuts. When the recession hit, enrollment in higher education went up and state investment went down -- and while most states cut higher education funding after the recession, Oregon’s cuts were some of the largest.
“The recent reinvestment on the part of the Legislature reflects really turning the corner for the state,” said Ben Cannon, executive director of Oregon's Higher Education Coordinating Commission. “We’re out of the cellar and closer to the ground floor, but we’ve got a long way to go.”
Cannon is cautiously optimistic about the increases in Oregon. While the state is starting to recover and return to pre-recession levels of funding, Cannon thinks it is still far from where it once was.
“We’re certainly pointed in the right direction,” he said. “But I think we have to be also cognizant of our history and revenue and spending structures that create no assurances that this trajectory can be sustained.”
Palmer is equally hesitant. It’s easier to reduce funding for higher education than it is for many other items in state budgets, he said, and higher education’s recovery is tenuous.
“There is a sense among many analysts that over the long haul, these recoveries have not yet been full recoveries,” he said. “That over the long haul, we’ve been losing ground.”
Percent Change in State Appropriations
| States | Total Support, Fiscal 2016 | 1-Year Change, 2015-2016 | 5-Year Change, Including Stimulus Funds |
| Alabama |
$1,495,204,091 |
1.80% | -3.10% |
| Alaska | 361,313,700 | -6.10% | 3.80% |
| Arizona |
790,861,600 |
-14.00% | -27.30% |
| Arkansas |
987,607,481 |
-0.40% | -2.80% |
| California |
13,159,274,906 |
7.10% | 19.80% |
| Colorado |
864,901,546 |
11.10% | 13.30% |
| Connecticut |
1,195,472,274 |
7.30% | 11.10% |
| Delaware |
230,005,700 |
1.50% | 8.30% |
| Florida |
4,373,335,560 |
3.60% | 6.20% |
| Georgia |
3,008,844,318 |
3.60% | 1.80% |
| Hawaii |
599,395,080 |
5.50% | 14.40% |
| Idaho |
419,045,700 |
4.40% | 20.40% |
| Illinois | N/A | N/A | N/A |
| Indiana |
1,777,700,217 |
5.70% | 13.60% |
| Iowa |
849,068,059 |
0.20% | 11.90% |
| Kansas |
793,723,305 |
-1.20% | -0.20% |
| Kentucky |
1,176,943,500 |
0.10% | -8.40% |
| Louisiana |
1,186,186,357 |
5.90% | -25.00% |
| Maine |
285,418,014 |
4.80% | 3.20% |
| Maryland |
1,821,498,388 |
0.70% | 14.10% |
| Massachusetts |
1,493,700,338 |
2.10% | 23.00% |
| Michigan |
1,825,523,600 |
2.30% | -2.40% |
| Minnesota |
1,532,825,000 |
6.00% | 10.70% |
| Mississippi |
1,038,807,427 |
2.90% | 1.90% |
| Missouri |
1,035,360,643 |
0.40% | 3.40% |
| Montana |
249,277,353 |
3.50% | 19.00% |
| Nebraska |
746,592,380 |
4.10% | 14.20% |
| Nevada |
538,609,215 |
10.50% | -2.10% |
| New Hampshire |
133,738,047 |
8.60% | -2.80% |
| New Jersey |
2,068,260,000 |
-0.10% | 0.90% |
| New Mexico |
923,213,539 |
2.60% | 9.50% |
| New York |
5,600,379,681 |
1.20% | 6.90% |
| North Carolina |
3,842,709,309 |
4.80% | 1.60% |
| North Dakota |
446,375,162 |
9.00% | 43.20% |
| Ohio |
2,236,671,785 |
4.80% | -2.00% |
| Oklahoma |
1,021,805,262 |
-3.10% | -10.60% |
| Oregon |
779,402,708 |
16.20% | 19.90% |
| Pennsylvania | N/A | N/A | N/A |
| Rhode Island |
179,639,520 |
4.80% | 9.10% |
| South Carolina |
1,026,089,319 |
5.80% | 10.50% |
| South Dakota |
222,071,793 |
2.10% | 12.90% |
| Tennessee |
1,639,925,353 |
3.80% | -1.20% |
| Texas |
7,417,595,527 |
8.70% | 18.30% |
| Utah |
933,251,500 |
5.10% | 27.00% |
| Vermont |
90,800,014 |
-0.90% | -3.60% |
| Virginia |
1,861,817,203 |
2.90% | -2.20% |
| Washington |
1,770,882,000 |
12.00% | 11.20% |
| West Virginia |
486,264,899 |
-3.80% | -9.10% |
| Wisconsin |
1,471,162,500 |
-8.10% | 10.60% |
| Wyoming |
419,149,337 |
11.20% | 8.90% |
| Average (Excluding Ill. and Pa.) | 4.10% | 7.40% |


