You have /5 articles left.
Sign up for a free account or log in.
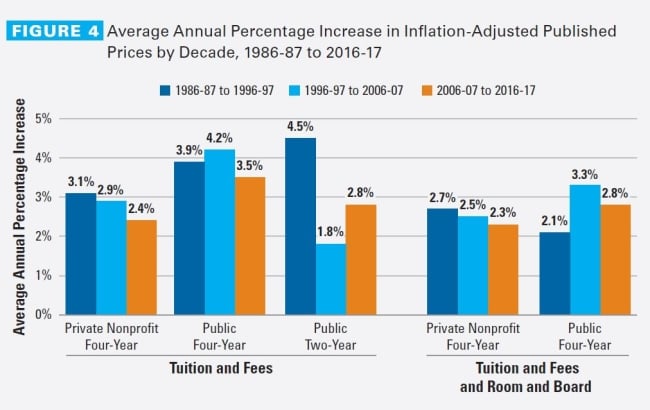
Average annual growth rates of published prices in inflation-adjusted dollars vary by decade and institution type. Average tuition and fee prices are in-district charges for public two-year institutions and in-state charges for public four-years.
College Board
Tuition pricing, financial aid and student debt levels are still in their postrecession mold.
Prices followed a continuing pattern of slowing growth between 2015-16 and 2016-17 while still increasing more quickly than financial aid availability and family incomes, according to two College Board reports released Wednesday, “Trends in College Pricing” and “Trends in Student Aid.” Meanwhile, total education borrowing decreased for the fifth consecutive year as undergraduates relied less on loans to finance their education.
It’s a stark difference from what happened during the Great Recession itself, when borrowing spiked and tuition prices turned sharply upward. But the trends are a continuation of those that have been in place since the recession ended, according to Sandy Baum, a senior fellow at the Urban Institute who co-wrote the reports.
“There’s no dramatic change this year,” she said. “Borrowing is continuing to decline per undergraduate student. Sticker prices are continuing to increase, but not at a really rapid rate.”
Tuition and Fees
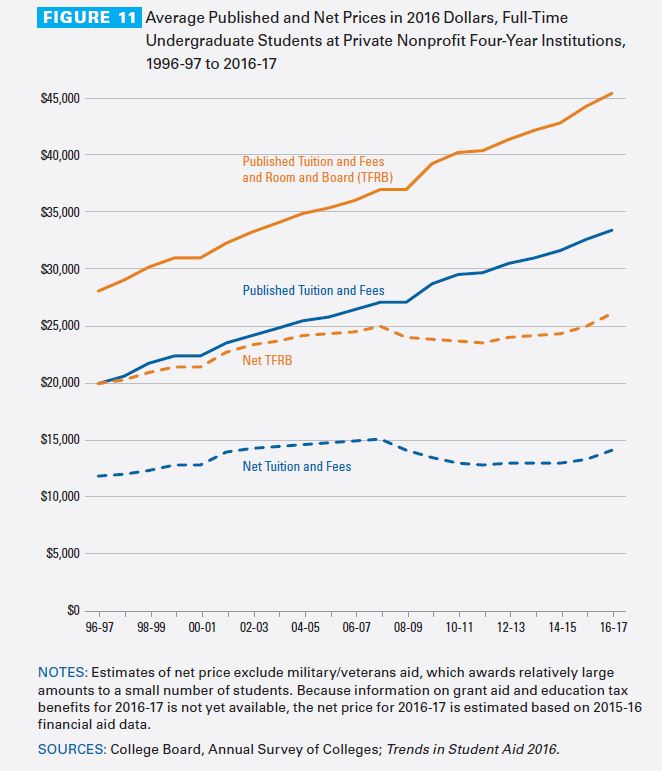
Published tuition and fees grew across the board in higher education sectors in 2016-17, but at a slower rate than last year. In the private nonprofit four-year sector, average tuition and fees grew 2.7 percent between 2015-16 and 2016-17 to $33,480, adjusting for inflation. That was less than the 3.2 percent growth the year before.
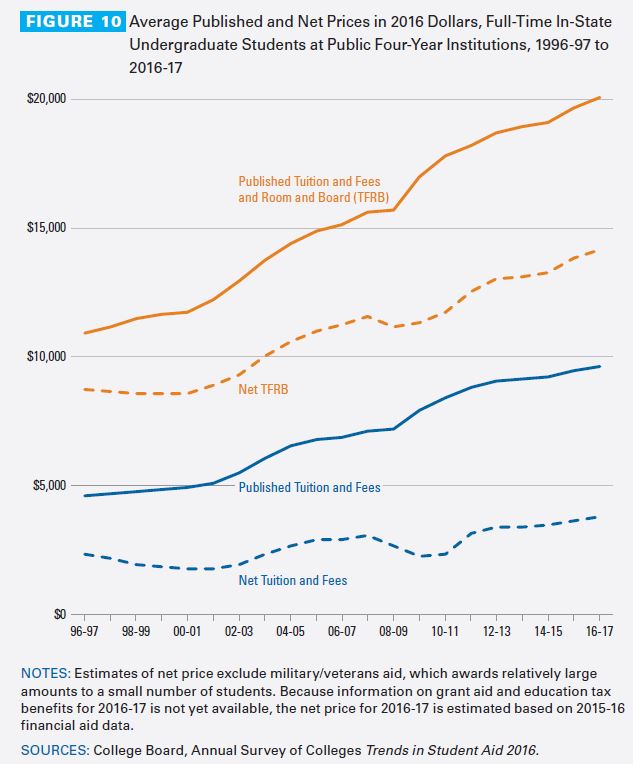
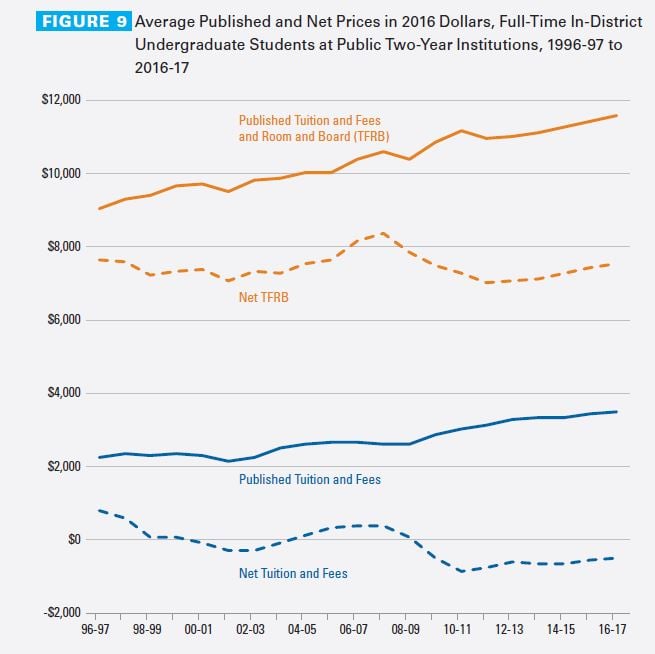
In the public four-year sector, average in-state tuition and fees grew 1.6 percent between 2015-16 and 2016-17 to $9,650. The increase was down from 2.8 percent the previous year. And in the public two-year sector, average tuition and fees grew by 1.7 percent to $3,520 -- less than the 2.7 percent growth posted the year before.
Last year’s growth figures generally come in below tuition and fee growth averages for previous decades. Private nonprofit four-year institutions averaged 2.4 percent annual tuition and fee increases between 2006-07 and 2016-17, after adjusting for inflation. They averaged 2.9 percent annual increases for the preceding decade starting in 1996-97, and 3.1 percent annual increases from 1986-87 to 1996-97.
Public four-year institutions averaged 3.5 percent annual increases in the last decade. They averaged 4.2 percent annual increases in the decade starting in 1996-97 and 3.9 percent in the decade starting in 1986-87. Public two-year institutions averaged 2.8 percent annual growth rates last decade, 1.8 percent the decade before and 4.5 percent growth rates in the decade starting in 1986-87.
But the collective effect of year-after-year price increases means published tuition and fees are still significantly higher than they were three decades ago. The average published tuition and fee price in the private nonprofit four-year sector is about 2.3 times higher this year than it was in 1986-87, after adjusting for inflation. It is 3.1 times higher in the public four-year sector and 2.4 times higher in the public two-year sector.
Published tuition and fees do not move in lockstep with changes in the net prices students actually pay -- students receive grant aid and tax benefits that shrink their actual college expenses. Full-time undergraduates in the private nonprofit four-year sector received an average of $19,290 in grant aid and tax benefits this year, covering 58 percent of their average published tuition and fees. Full-time students at public four-year colleges received an average of $5,880 in grant aid and tax benefits, covering roughly 60 percent of in-state tuition and fees. Grant aid more than covered tuition and fees for full-time students at public two-year institutions, on average.
Looking at net price makes it clear students haven't been paying the full quoted increases in tuition prices. In particular it shows institutions collecting less in tuition and fees per student even as they raised sticker prices during recessionary years. Net prices haven't fully recovered in some cases, although they are trending up in recent years across all sectors.
Average net tuition and fees for full-time students in the private nonprofit four-year sector rose to $14,190 this year, up from $12,770 in 2011-12. The change means that net price charged by the sector is climbing back from a dip during the recession years but has yet to match higher levels like the $14,900 seen in 2006-7.
In the public four-year sector, average net tuition and fee prices have eclipsed highs from a decade earlier. They came in at $3,770 this year, up from $2,910 a decade ago and up from a recession-era low of $2,220 in 2009-10. The increases come as state subsidies for higher education are locked in a downward trend, with appropriations per full-time equivalent student 8 percent lower in 2014-15 than they were a 10 years earlier, after adjusting for inflation.
Public two-year colleges’ average net tuition and fee price was $500 below zero this year, down from $420 above zero in 2006-7 but up from $860 below zero in 2010-11. The negative net price indicates students receive more in grant aid and tax credits than is required to cover tuition and fees. Students can use surplus funds for supplies or living expenses, according to the College Board. The College Board has in the past taken criticism for not including in its net price calculations some cost-of-attendance expenses and for including tax credits that students and their families don't immediately receive.
It’s important to note that the tuition and fee changes come against the backdrop of total postsecondary enrollment falling 4 percent between 2010 and 2014. Enrollment trends broke in different ways at different types of institutions, growing at private nonprofit and public four-year institutions while shrinking at others.
Private nonprofit enrollment grew from 3.7 million students in 2010 to 3.8 million students in 2014 -- or from 17 percent of all students to 19 percent of all students. Public four-year students grew from 7.2 million in 2010 to 7.5 million in 2014, or from 34 percent of all students to 36 percent of all students.
Meanwhile, public two-year institutions lost market share, with enrollment falling from eight million students in 2010 to 7.3 million in 2014 -- or from 38 percent of enrollments to 35 percent. For-profit enrollment fell from 2.4 million in 2010 to 1.9 million in 2014 -- from 11 percent of students to 9 percent.
Analysts have attributed that change to the economy improving, drawing more people into the labor market who may have turned to trade education in a worse job market.
Student Aid
Overall student aid levels have been roughly steady for the last two years after jumping during the recession. Undergraduates and graduate students received a total of $240.9 billion in aid in 2015-16 -- aid coming in grants from various sources including states, federal loans, federal work-study and federal tax credits and deductions. The level was down slightly from $241 billion the previous year and from a high of $258.8 billion in 2010-11. But it was still 61 percent higher than levels 10 years ago, when aid totaled $149.9 billion.
Grants exhibited some of the strongest growth in the last decade, with federal grants rising 106 percent, driven by significant Pell Grant growth of 88 percent to $28.2 billion, and even larger veterans' benefits and military growth, 106 percent to $43.3 billion. Institutional grants rose 88 percent to $54.7 billion, and state grants grew 22 percent to $10.5 billion. Of those categories, only institutional grants and grants to veterans and the military rose year over year in 2015-16, though.
Institutional grants have increased since the recession years. The continued high discount rates raise questions about whether institutions are discounting to make tuition affordable for low-income students or whether they are competing for high-income students who can generate revenue.
“I think it raises the question of what’s hidden behind those averages, both in terms of different kinds of institutions and different kinds of students,” Baum said. “For which students are they discounting?”
Nonfederal loans, meanwhile, fell 47 percent over the last decade, from $20.9 billion in 2005-06 to just under $11 billion in 2015-16. Private sector loans accounted for a vast majority of the drop, falling by 49 percent to $9.9 billion after peaking at $24.2 billion in 2007-8.
The latest student aid data indicates that steep increases in awarded aid during the recession years of 2009-10 and 2010-11 were short-term changes driven by extreme financial circumstances, the College Board report said. Since those years of the crisis, federal loans fell for five straight years. Total expenditures on federal Pell Grants have fallen each year since 2010-11.
The average financial aid package per full-time equivalent undergraduate student totaled about $14,460 in 2015-16, virtually unchanged since 2011-12. It includes $8,390 in grants from different sources, $4,720 in federal loans, $1,290 in education tax credits and deductions and $60 in federal work-study.
Graduate students’ packages averaged $27,740 per full-time equivalent, up about $1,000 from 2011-12. Grants accounted for $9,300, federal loans accounted for $17,460, tax credits and deductions were worth $890 and work-study was worth $90.
The College Board recorded a recent trend in the way the aid breaks down, however. Undergraduates are relying less on loans and more on grants in recent years. Loans from federal and nonfederal sources accounted for 36 percent of undergraduate aid in 2015-16, the lowest level in two decades. Grants were 55 percent, the highest level in two decades.
Federal loans per full-time equivalent undergraduate fell during the five-year period by $960. Grant aid per undergraduate rose by $750.
Graduate students, in contrast, continued to rely far more heavily on loans. Loans were 64 percent of the aid they used in 2015-16. Grants were 33 percent.
Federal loans per full-time equivalent graduate student fell by $1,240 over the last five years but rose in the most recent year. Grant aid per graduate student increased by $1,830.
Total education borrowing fell for the fifth straight year. Students and parents borrowed $106.8 billion, down from a high of $124.2 billion in 2010-11, adjusted for inflation. A large chunk of all borrowers with student loan debt -- 38 percent -- owed less than $10,000. A substantially smaller portion, 16 percent, owed $40,000 or more.
There is no clear explanation for the drop in overall borrowing, Baum said. She hopes it can cool the sharp rhetoric that has flown recently over the issue of student debt.
“My hope is things are calming down somewhat,” she said. “Maybe we can have a more rational conversation about borrowing and student debt.”
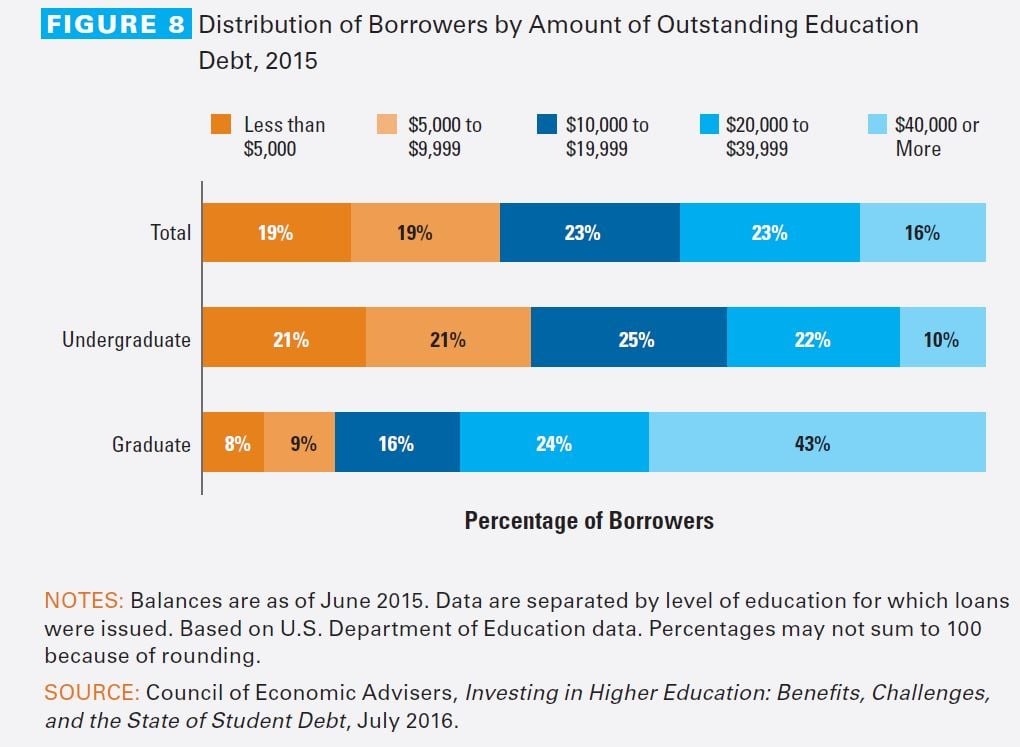
As would be expected given their greater reliance on borrowing, graduate students tended to rack up more debt than undergraduates. Just 10 percent of undergraduate borrowers owed $40,000 or more. That compares to 43 percent of graduate borrowers.
“Students are still borrowing a lot of money,” Baum said. “This year we did want to focus on the graduate student borrowing.”
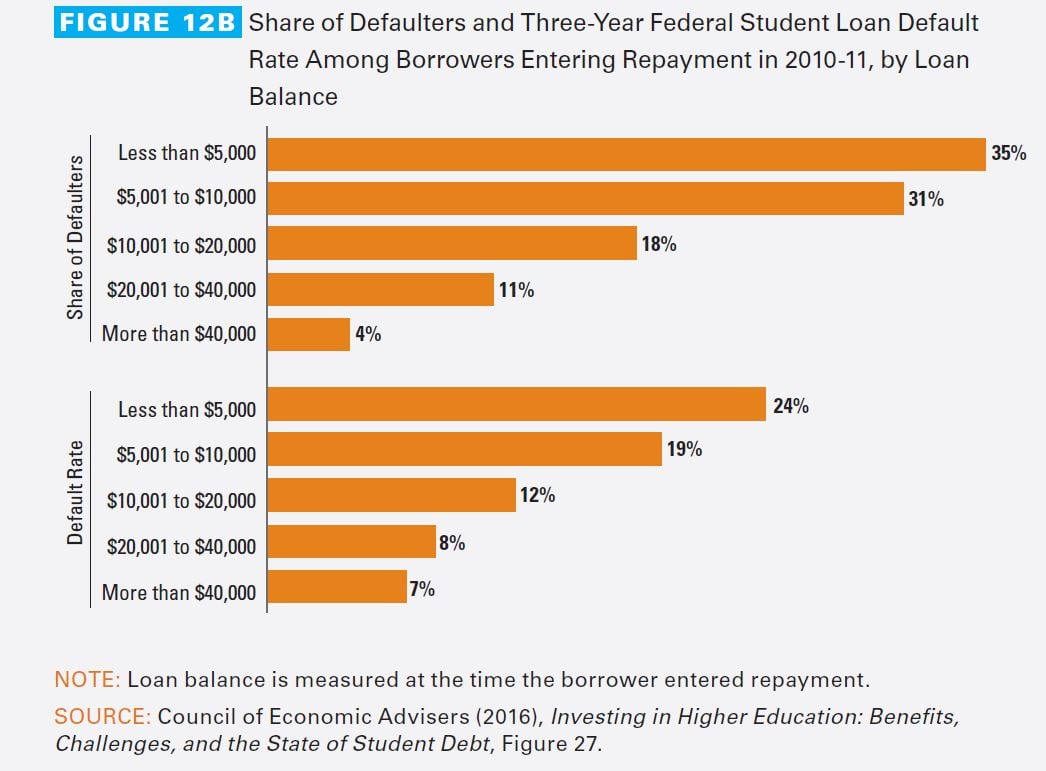
Selective colleges’ undergraduates and students borrowing for graduate school posted the largest debts -- but also the lowest default rates. Default rates tended to be highest among students attending for-profit and public two-year colleges. They also have the smallest debts.
Borrowers who left school owing less than $5,000 posted the highest default rates. Default rates decline as loan balances increase, the College Board noted.
Nearly a quarter of federal student loan borrowers who left school without a degree or certificate and entered repayment in 2011-12 defaulted on their loans within two years -- 24 percent. Only 9 percent of students who completed their degrees and programs did so.
Data show income-driven repayment plans for federal student loans becoming significantly more popular of late. In 2016, a full quarter of borrowers in repayment on federal direct loans were in such programs, which limit loan payments to an affordable percentage of disposable income. Only 11 percent of borrowers were in the plans in 2013.
As of the third quarter of 2016, borrowers in income-driven repayment plans held 43 percent of the outstanding debt in repayment under the federal Direct Loan program. That’s up from 23 percent in 2013.
Only 16 percent of borrowers in income-driven repayment plans were in default. They represented 10 percent of dollars outstanding, meaning defaulters had lower average balances than other borrowers.