You have /5 articles left.
Sign up for a free account or log in.
The traditional model for a college president has remarkable staying power.
Despite years of talk about increasing diversity, chatter about interest in hiring from outside academe and buzz about a coming wave of retirements, college and university presidents in 2016 looked much like they did five years before. They still tended to be aging white men. And they kept getting older.
Those are some key takeaways from the latest version of the American College President Study from the American Council on Education, which is being released today. The study, which has been released every few years dating back to 1986, provides a closely watched, comprehensive look at the makeup of the college and university presidential work force.
The newly released study found some small gains in the number of women and minority presidents -- but increases took place at a slow pace that surprised many observers. Women are a majority of all undergraduates in the United States, and the number of minority students is projected to grow considerably in the future. Yet less than a third of college presidents were women in 2016. Less than a fifth were members of a racial or ethnic minority group -- and that low portion is driven up significantly by presidents at minority-serving institutions, who tend to be members of minority groups in greater than average numbers themselves.
Meanwhile, the average president was 61.7 years old, up from 60.7 years old in 2011 and 59.9 years old in 2006. Almost a quarter of presidents, 23.9 percent, had held presidential or chief executive officer positions in their job before their current presidency. That’s up from 19.5 percent in 2011 and above the 21.4 percent reported in 2006.
The data suggest colleges and universities are prioritizing experience when they have to hire a president, according to ACE. But because presidents have historically been white men, the emphasis on experience comes at a cost to hopes of increasing diversity.
“As college and university presidents seem to be chosen as much for their experience as anything else, that is going to narrow the pool,” said Jonathan Gagliardi, associate director of ACE’s Center for Policy Research and Strategy. “It will certainly work against diversifying the pipeline in a more expedient fashion.”
Slow to Diversify
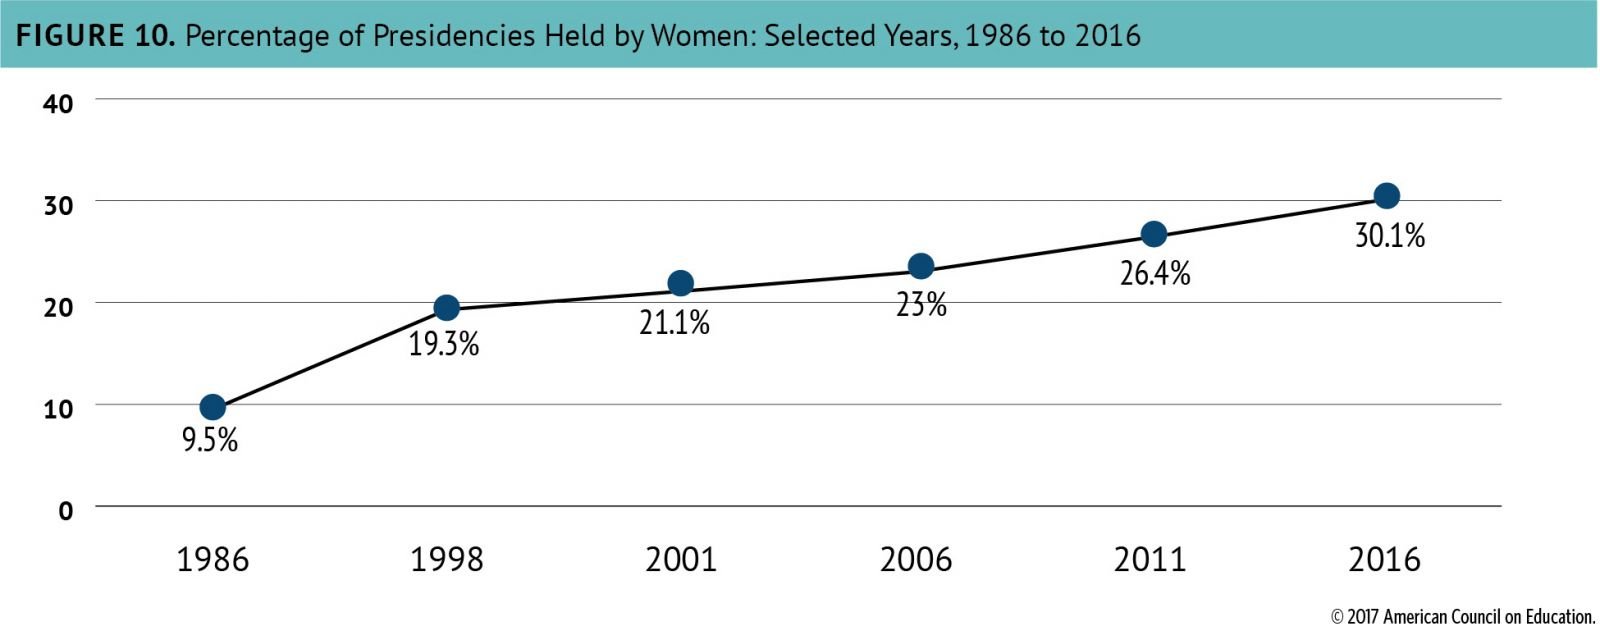
Only 30.1 percent of presidencies were held by women in 2016, up from 26.4 percent in 2011 and 23 percent in 2006. The rate of increase has slowed considerably in recent years -- it grew from 9.5 percent in 1986 to 21.1 percent in 2001.

Public institutions had a higher percentage of women presidents than private nonprofit institutions. Almost 33 percent of public colleges and universities had women presidents in 2016, compared to 27.3 percent of private nonprofits. Community colleges were the most likely to have women presidents, with about 36 percent headed by women.
The portion of minority presidents across the board grew to 16.8 percent in 2016, up from 12.6 percent in 2011 and 13.6 percent in 2006. Almost all of the growth came from African-American presidents. The portion of African-American presidents grew to 7.9 percent in 2016 from 5.9 percent five years earlier. The portion of Hispanic presidents stayed roughly steady -- rising to 3.9 percent from 3.8 percent -- as did the portion of American Indian and Alaska Native presidents, which was 0.7 percent in 2016 and 0.8 percent in 2011. The percentage of Asian-American presidents grew slightly, rising to 2.3 percent from 1.5 percent.
Public colleges and universities were more likely to have a minority president than private ones -- public institutions were led by minority presidents 22.3 percent of the time in 2016, while private nonprofit institutions had minority presidents just 10.6 percent of the time.
An important wrinkle is that many minority presidents work at minority-serving institutions. Excluding minority-serving institutions, just 11 percent of all colleges and universities in the ACE survey were headed by minority presidents.
Further, fewer minority-serving institutions were led by minority presidents in 2016. About 36 percent of minority-serving institutions had minority presidents in 2016, compared to 53 percent in 2011.

Slow growth in diversity concerned many experts and former presidents. Alvin Schexnider, a senior fellow with the Association of Governing Boards and a former chancellor of Winston-Salem State University, said the data indicate increases in diversity are unlikely without major efforts.
“Positions are held mainly by white males, and the need to diversify is self-evident,” he said. “I just think that, given the history, that’s going to be a tough climb unless there are some aggressive steps.”
The larger diversity trends obscured some other significant changes. The percentage of Hispanic presidents who were women dropped significantly from 2011 to 2016, falling from 38.7 percent to 21.7 percent. The percentage of white presidents who were women rose from 25.1 percent to 30.1 percent. The portion of African-American presidents who were women held steady at about one-third.
Breaking down growth in minority presidents by institution type shows community colleges posting the largest growth and highest percentage of presidents who were racial or ethnic minorities. Slightly more than 20 percent of community college presidents were minorities in 2016, up from 12.7 percent five years earlier. Doctorate-granting institution presidents were 18 percent minority, up from 12.9 percent. Fifteen percent of presidents at master’s-granting institutions were minorities, up from 12.5 percent, and 14.9 percent of presidents at bachelor’s-degree granting institutions were minorities, up from 11.9 percent.
Other Age Findings
The top-line finding on presidential age also obscures some important developments related to age and tenure. College presidents are getting grayer in large part because of growth in the numbers of the oldest presidents. They are also getting more experienced and staying in jobs for shorter stints.
The increasing average age of college presidents is driven in large part by a sharp increase in the number of presidents over age 70. The portion of presidents age 71 or older jumped to 11 percent in 2016, up from 5 percent in 2011. That came even as the share of presidents older than 60 held steady at 58 percent.
College presidents are also spending less time in each job. The average tenure of a college president in their current job was 6.5 years in 2016, down from seven years in 2011. It was 8.5 years in 2006.
More than half of presidents, 54 percent, said they planned to leave their current presidency in five years or sooner. But just 24 percent said their institution had a presidential succession plan.
“The amount of years that individuals spend as presidents has declined dramatically over the course of the last couple of decades,” said ACE President Molly Corbett Broad. “And so I think this is the clearest signal of the impact on leaders in the face of the dramatic kinds of change we are experiencing in today’s world.”
The trend of hiring presidents from outside higher education took a step back, according to the ACE study. It had grown from 13 percent in 2006 to 20 percent in 2011, and many boards and search committees have reported interest in hiring from outside the halls of academe. But the share of presidents coming from outside higher education dropped to 15 percent in 2016.
The percentage of presidents who had ever worked outside higher education rose from 47.8 percent in 2011 to 58 percent in 2016. But the percentage who had never been a faculty member fell from 30.4 percent to 18.8 percent. The most popular career pathway for new presidents continued to be through academic administration, as 42.7 percent of presidents said their most recent prior position was as a chief academic officer, provost, dean or other senior executive in academic affairs.
“They’re coveting experience explicitly in higher education,” Gagliardi said. “And I think that’s to be expected given the major funding challenges that many colleges and universities are experiencing and the level of entrenchment they may feel they’re getting from the internal constituents that you kind of need experience to have legitimacy with.”
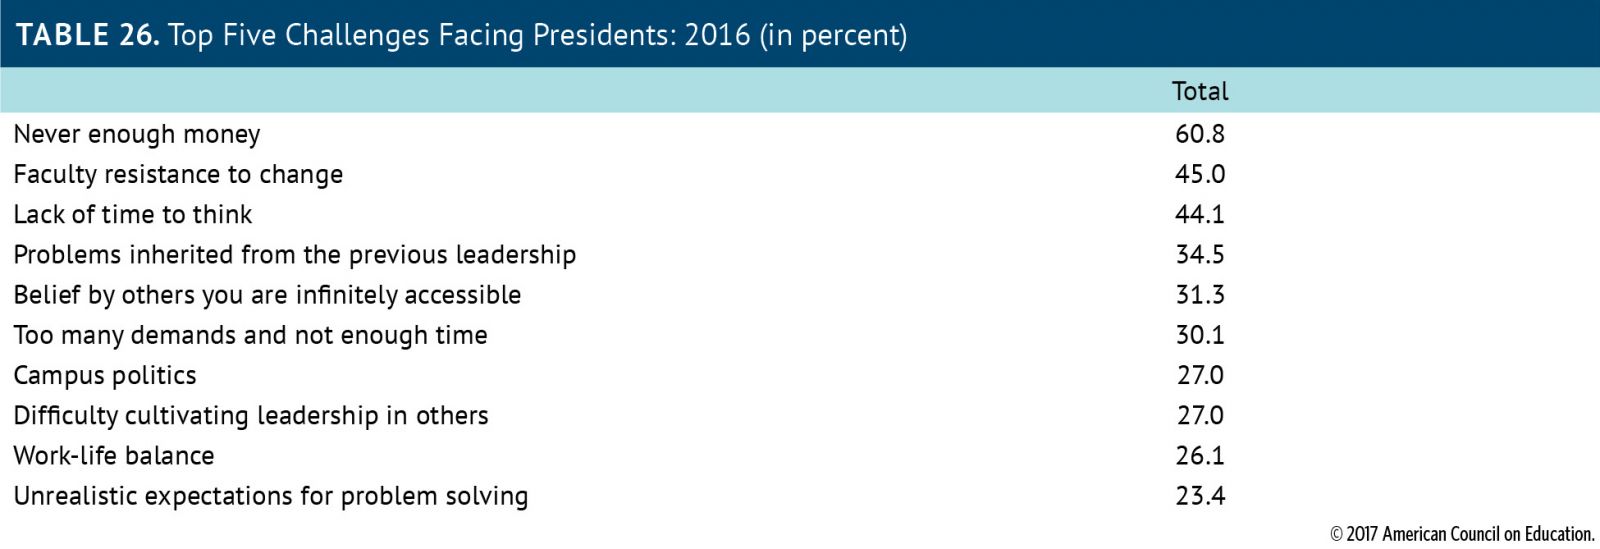
ACE asked presidents about their top challenges. Their top answer was never having enough money, named by 60.8 percent of presidents. Next was faculty resistance to change, listed by 45 percent, and a lack of time to think, named by 44.1 percent.

Presidents were asked about their top internal constituencies that understood institutional challenges the least. They first named students. Second, they named faculty.
ACE also asked presidents about their top uses of time. Almost two-thirds, 64.9 percent, named budget and financial management as a primary use of time. That was closely followed by fund-raising, cited by 58.1 percent of presidents.
Asked to predict the future of key revenue sources, presidents were most down on government funding and most optimistic about external funding. More than 41 percent said they expected state government funding to decrease in the next five years. Almost 28 percent expected federal government funding to decrease.
A vast majority, 84.7 percent, expected private gifts, grants and contracts to rise. Three-quarters expected tuition and fees to increase. And 63.7 percent anticipated endowment income to increase.
The predictions caught the eyes of some as being overly optimistic.
“I'm particularly struck that, as a group, we think we will see increased revenues from virtually all sources -- tuition, endowments, gifts and grants,” said Kathleen Murray, president of Whitman College, in an email. “I just don't see how that is possible.”
Under 20 percent of presidents said strategic planning was an area of importance for the future. Only 12 percent said using institutional research to inform decision making was an area of importance.
That raised worries that presidents will be jumping from issue to issue without ever addressing the long term.
“Without a clear set of institutional strategic priorities that are informed by data, both financial decisions and fund-raising goals are based on a whim,” said Susan Resneck Pierce, former president of the University of Puget Sound and president of SRP Consulting. “In addition, without a clear set of strategic goals informed by data, the annual operating budget becomes the de facto plan.”
The survey also included some data on the personal lives of presidents and the perks they receive. Most presidents -- 85 percent -- were married. Another 1 percent had domestic partners.
A president’s college or university employed his or her spouse 12 percent of the time. An additional 38 percent of presidential spouses worked outside the institution.
Many presidents, 84 percent, had children. Yet only 22 percent had children under age 18.
Most presidents, 81 percent, said they received a written contract with their job offers. Three-year contracts were most common, reported by 34 percent of presidents -- although three-year terms were also most common among community college presidents. Contracts of five years or more were more common for doctorate-granting, master’s and bachelor’s institutions, as well as special-focus institutions.
Two-thirds or more of all presidents said they received benefits like pension or retirement benefits, an automobile, and life insurance. At least one-third said they received benefits like deferred compensation, an entertainment budget, health and wellness benefits, a presidential residence, memberships to professional associations or social clubs, and merit-based salary increases.
Presidents at private colleges and universities were more likely to receive such perks.
Many saw those benefits as a reminder that the presidency has its advantages, despite being a job filled with pressures.
“While it is surely true that being a college or university president can be a stressful job, it is also true that there is no lack of applicants for every open presidency,” said John Lombardi, former president of the University of Florida and the Louisiana State University System, in an email. “It is also clear, as emphasized in the data here, that at least for those who responded to the survey, the perks of being president are significant and much greater than the perks enjoyed by most of those within the institutions the presidents serve. Presidents are paid well by and large, they have many benefits not available to others in the university community, and while the job is surely difficult, so too are many other jobs within the academic world.”


