You have /5 articles left.
Sign up for a free account or log in.

iStock
Picture campus leaders and state policy makers as a movie or cartoon character with the angel on one shoulder and the devil on the other. In this instance the angel -- echoing the views of financial aid experts and advocates for low-income students -- is saying, “Direct your precious dollars toward need-based aid, which is better targeted to lower-income students and others who may not otherwise go to college.”
The devil, meanwhile, pushes a practical approach: “We need to use some of our aid more strategically to keep or attract some talented (but not financially needy) students who will help our (fill in the blank: rankings, debate team, fund-raisers) and will go to (fill in nearby competitor) if we don't throw a few dollars their way.”
Hyperbole aside, that tug-of-war afflicts campus administrators deciding how to award their institutional aid funds and state policy makers alike. New data, though, suggest that the angels are getting the better of their counterparts, slowly but surely, at least at the state level.
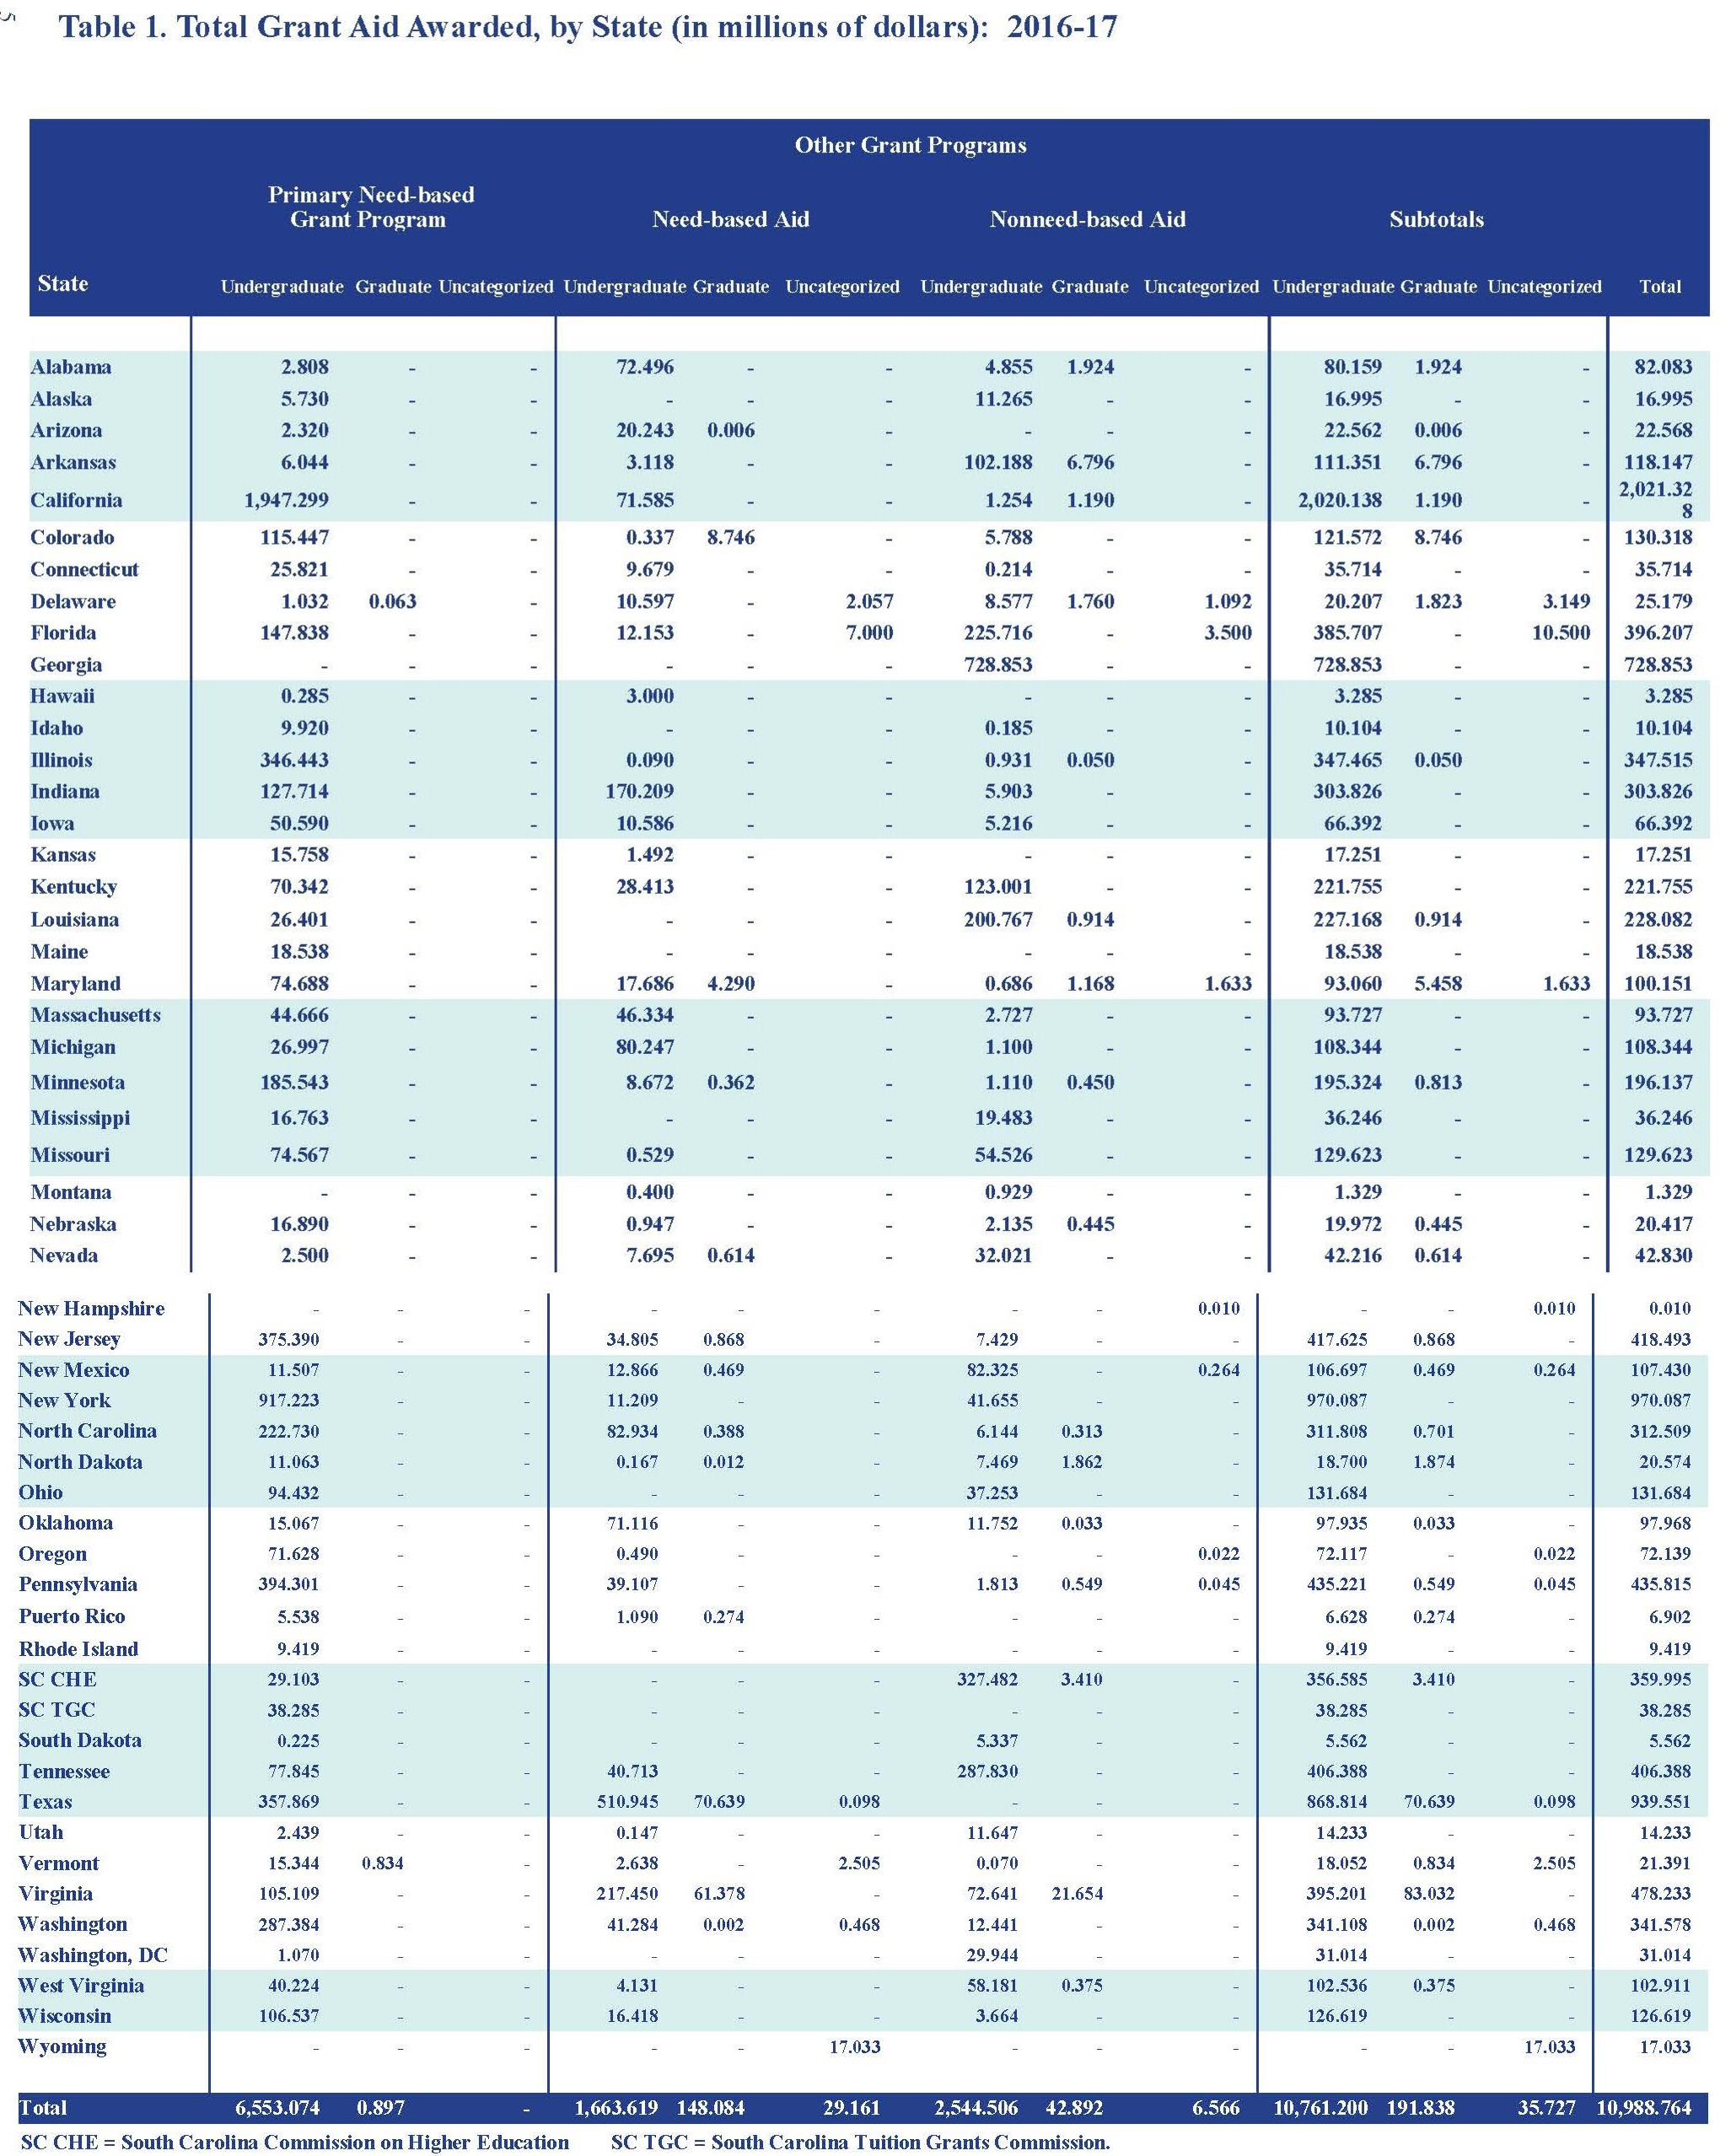
The annual report of the National Association of State Student Grant and Aid Programs, or NASSGAP, finds that the amount of all undergraduate financial aid that states allocated based on students' financial need grew by 2.9 percent from 2015-16 to 2016-17, the latest available data. (The NASSGAP study lags by a year due to data-collection demands.) Total need-based aid grew by 20.7 percent from 2011-12 to 2016-17 and by 52.2 percent from 2006-07 to 2016-17.
Grant aid that is based on factors other than (or in addition to) need, by comparison, grew by 0.7 percent from 2015-16 to 2016-17, 6.2 percent over five years and 21.9 percent over a decade.
States allocated a total of just under $11 billion in grant aid in 2016-17, and the proportion that was allocated based on need edged up to 76.6 percent, from 76 percent the year before. It was 72.2 percent in 2006-07.
To put it in dollar terms, states allocated $233 million more in need-based grants in 2016-17 than they did the previous year, and just $18 million in additional non-need-based grants.
|
Need-Based Grant Aid |
Non-Need-Based Grant Aid |
Total Aid | |||
|
Academic |
($000s) |
% of Total |
($000s) |
% of Total |
|
|
2006-07 |
$5,514,131 |
72.2% |
$2,128,165 |
27.8% |
$7,642,296 |
|
2011-12 |
$6,954,307 |
74.0% |
$2,442,949 |
26.0% |
$9,397,256 |
|
2015-16 |
$8,162,040 |
76.0% |
$2,575,341 |
24.0% |
$10,737,381 |
|
2016-17 |
$8,394,800 |
76.4% |
$2,593,964 |
23.6% |
$10,988,764 |
"Trying to get big increases in that [proportion] is like trying to change the course of a barge or ocean liner," said Frank Ballmann, who heads the state-aid association's Washington office. "But the shift to need does seem to be accelerating at an accelerating rate."
The Balancing Act
While need-based aid is uniformly favored by those who view financial aid (especially government-funded aid) primarily through its historical prism as a way to encourage college going, the use of merit-based financial aid -- once largely the province of private nonprofit colleges -- has been embraced by some states (especially in the South) to keep academically talented students within the states' own borders.
Major statewide lottery-funded programs have been criticized for aiding wealthier students more than poor ones, and the newest "in" state aid programs -- those that make tuition free for all state residents or large swaths of them -- also can disproportionately help upper-income students and families.
One highly touted instance of the latter, the Tennessee Promise program, for instance, has become a widely replicated model for "free tuition" programs, and come in for some criticism as a result.
But Ballmann said that the study offers some evidence that such programs, while not primarily need based, can still have a positive effect on access for low-income students.
Tennessee increased its spending on need-based financial aid by $10 million in 2016-17, while its spending on non-need-based aid remained flat. Ballmann attributed the increase in need-based spending largely to the resonance of the Promise program's "cleaner" message about college affordability -- the power of the word "free" -- and the requirement that prospective college students fill out the Free Application for Federal Student Aid, which has significantly raised the proportion of the state's high school graduates who do so, from 55 percent to more than 80 percent.
"So even if a Tennessee low-income student has not gotten Promise funds, the program is still having an influence on them going to college and getting money for it," Ballmann said.
Public vs. Private Institutions
One other area of state financial aid policy that has been drawing attention is the question of whether states are shifting their support toward students who attend public universities and away from those at private colleges, as leaders of independent institutions have increasingly worried about the free tuition programs.
The 2016-17 NASSGAP data predate any impact of New York's Excelsior Scholarship program, the most visible of the free tuition programs aimed at public college enrollees. They show that the proportion of all state need-based aid flowing to students at private nonprofit colleges was 20 percent, down slightly from 20.6 percent the year before. (Students at public institutions received 76.1 percent of the 2016-17 total, and those at for-profit colleges took in 2.3 percent.)
But the category that rose between 2015-16 and 2016-17 was "unspecified," at 1.5 percent percent, so Ballmann said it would be premature to conclude that private nonprofit students are necessarily losing out.


