You have /5 articles left.
Sign up for a free account or log in.
National Science Foundation/National Center for Science and Engineering Statistics
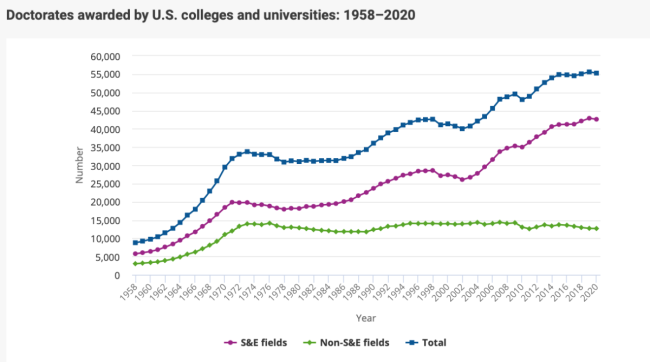
The number of doctorate recipients declined slightly in 2020, to 55,283 Ph.D.s across fields, from 55,614 in 2019. This is the first drop since 2017, according to new data from the National Science Foundation’s annual Survey of Earned Doctorates.
This year’s survey covers the 2020 academic year, from July 2019 to the end of the June 2020, so some but not all of the survey period covered the COVID-19 pandemic. It’s almost certain that COVID-19 played a role in how many students were able to finish their Ph.D.s toward the end of the survey period, but it’s unclear from the data how big a role. The NSF’s forthcoming 2021 survey will ask specific questions about the pandemic, so more will be known then. COVID-19’s impact will be seen for years after that, as well, given that numerous graduate programs suspended or reduced admissions due to the virus.
COVID-19 or not, the NSF and other researchers rely on the annual Survey of Earned Doctorates to track changes over time in who is getting a Ph.D. and in what fields, as such data often reveal broader educational, social, political, economic or technological trends. Such trends include the representation of women, minorities and temporary visa holders among Ph.D.s; the emergence of new fields and changing popularity of others; average time spent earning a degree; and postgraduation employment plans.
 The survey, which began in 1957, shows 3.1 percent average annual growth in the number of doctorates awarded. This has been punctuated by periods of slow growth and decline, however, the report notes—such as the current period.
Historically, the number of research doctorates in science and engineering (S&E) fields has exceeded the number of non–science and engineering doctorates, and this gap has widened over time.
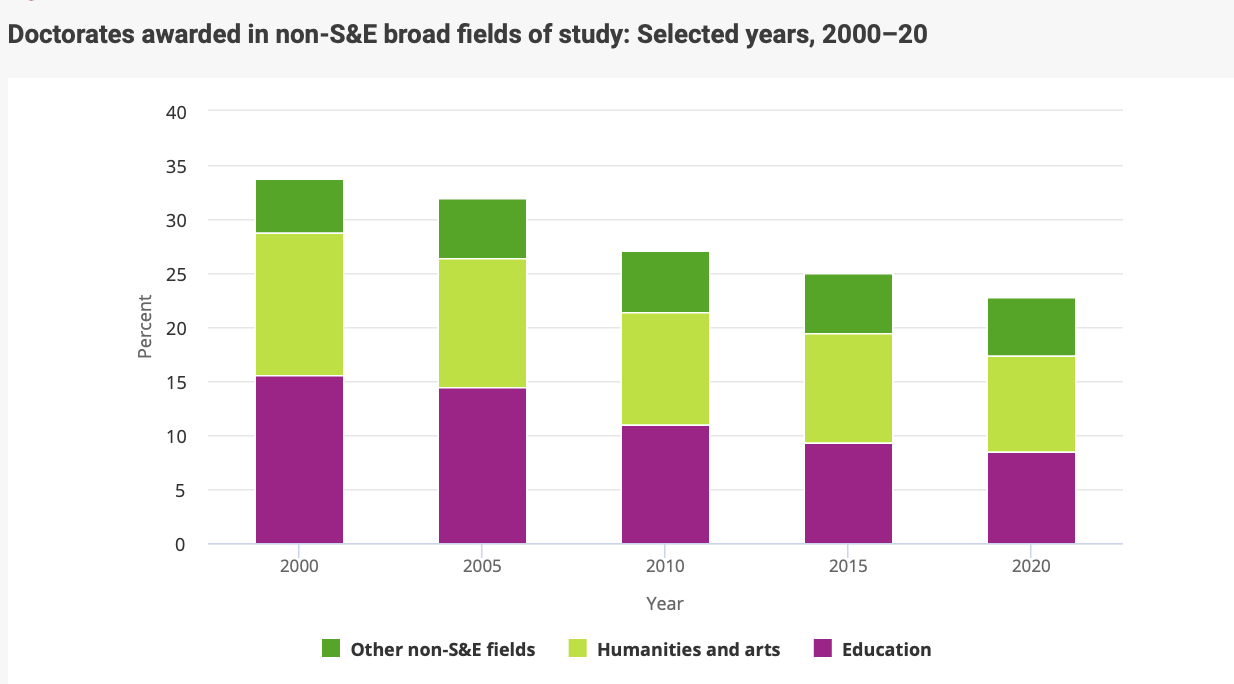
“From 1980 to 2020, the number of S&E doctorate recipients has more than doubled, while the number of non-S&E doctorates awarded in 2020 declined to just below the 1980 count,” the report says. “As a result, the proportion of S&E doctorates to all doctorates climbed from 58 percent in 1979 to 77 percent in 2020.”
 Another takeaway from the 2020 report: U.S. citizen and permanent resident doctorate recipients declined in number, to 34,492 from 35,232 in 2019. Meanwhile, the number of temporary visa holders who earned Ph.D.s increased slightly year over year, to 18,482 in 2020 from 18,324 in 2019. It’s possible that next year’s international student data will show more of impact from COVID-19, as international students faced specific challenges with respect to the pandemic. At the same time, many graduate students—international and not—faced serious logistical setbacks to their research during the pandemic, such as loss of access to their labs or other research materials. In any case, temporary visa holders who earned their degrees in 2020 were concentrated in several countries: 53 percent of these new Ph.D.s were from China, India or South Korea.
With faculty diversity and inclusion a focus of so many institutions, the NSF’s survey is an important indicator of whether the faculty pipeline is diversifying. Between 2019 and 2020, the number of doctorate recipients who were U.S. citizens and permanent residents declined across races—except for Hispanics and those reporting more than one race. Numbers in both of those demographic groups increased slightly.
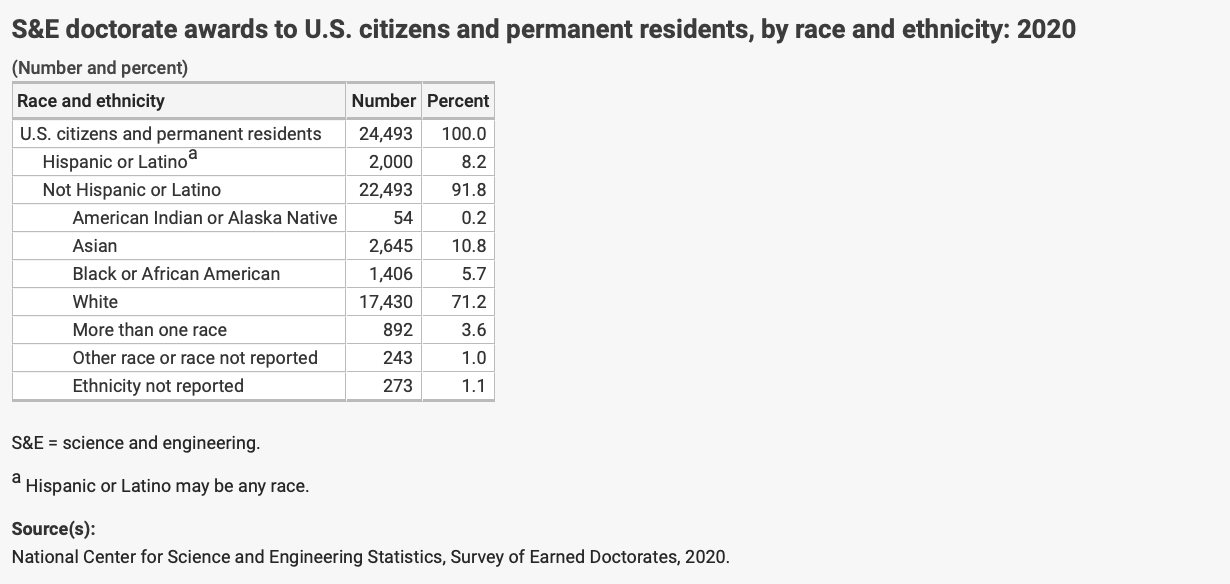 Over all, the share of underrepresented minority Ph.D. recipients from the U.S.—meaning Black, Hispanic and American Indian or Alaska Native—was stable year over year, at about 16 percent. This is still well below the share of the U.S. population that is Black, Hispanic or Native American, however, according to 2020 U.S. Census data.
While parental educational attainment was on the rise across races for U.S. citizens and permanent residents, the share of underrepresented minority new Ph.D.s with at least one parent with a bachelor’s degree also remained lower than that of white or Asian Ph.D.s.
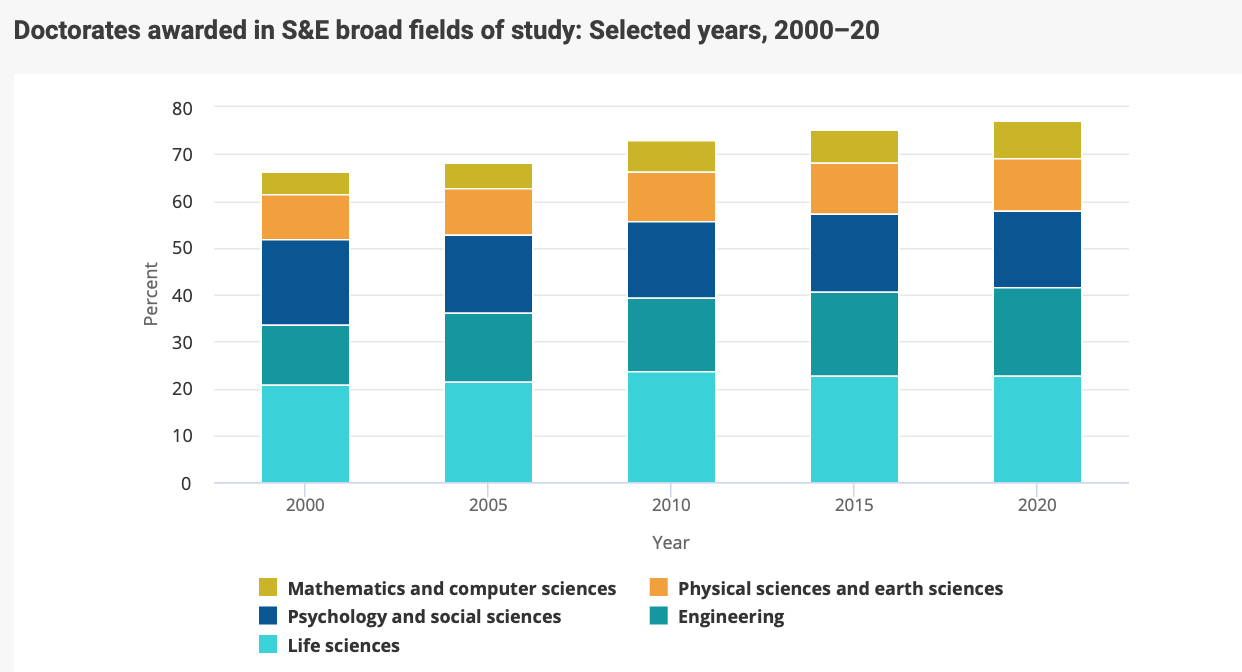
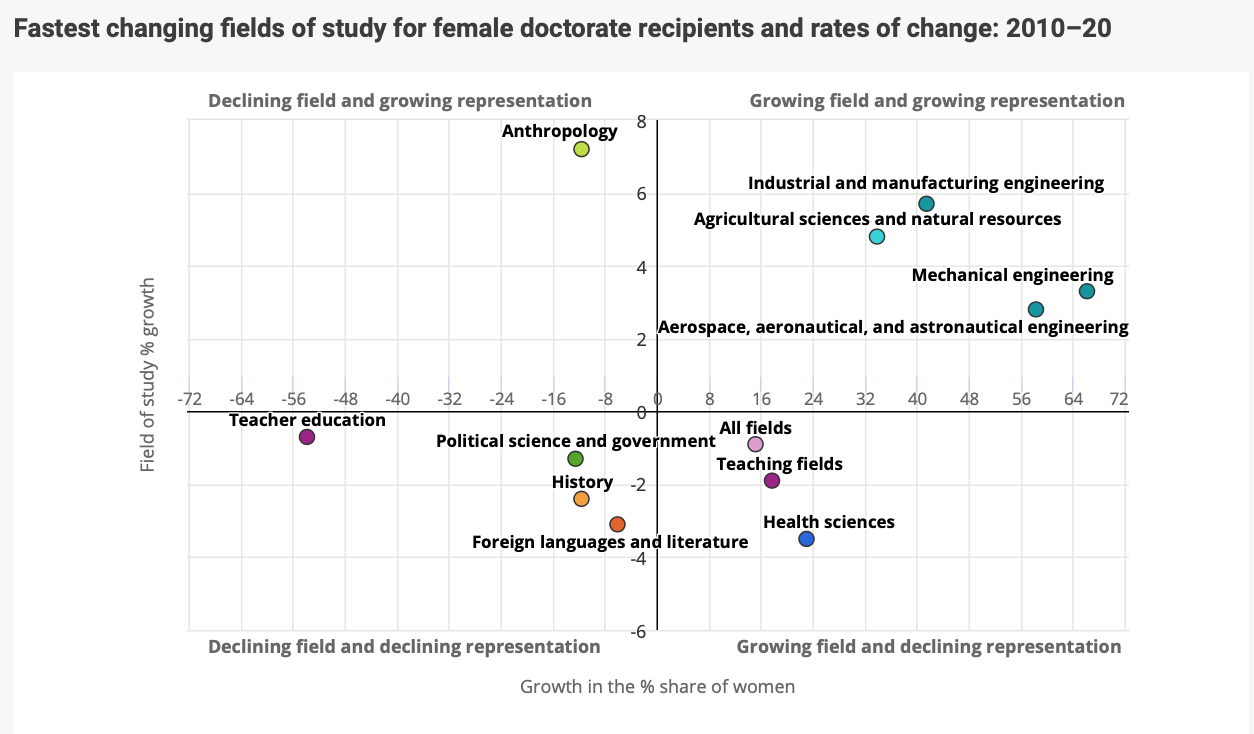
Women earned 49 percent or more of the doctorates awarded in life sciences, psychology and social sciences, education, humanities and arts, and other non–science and engineering fields, the 2020 survey says. They made up one-third of new physical science and earth science Ph.D.s and one-quarter of those in engineering, math and computer science.
 After the Ph.D.
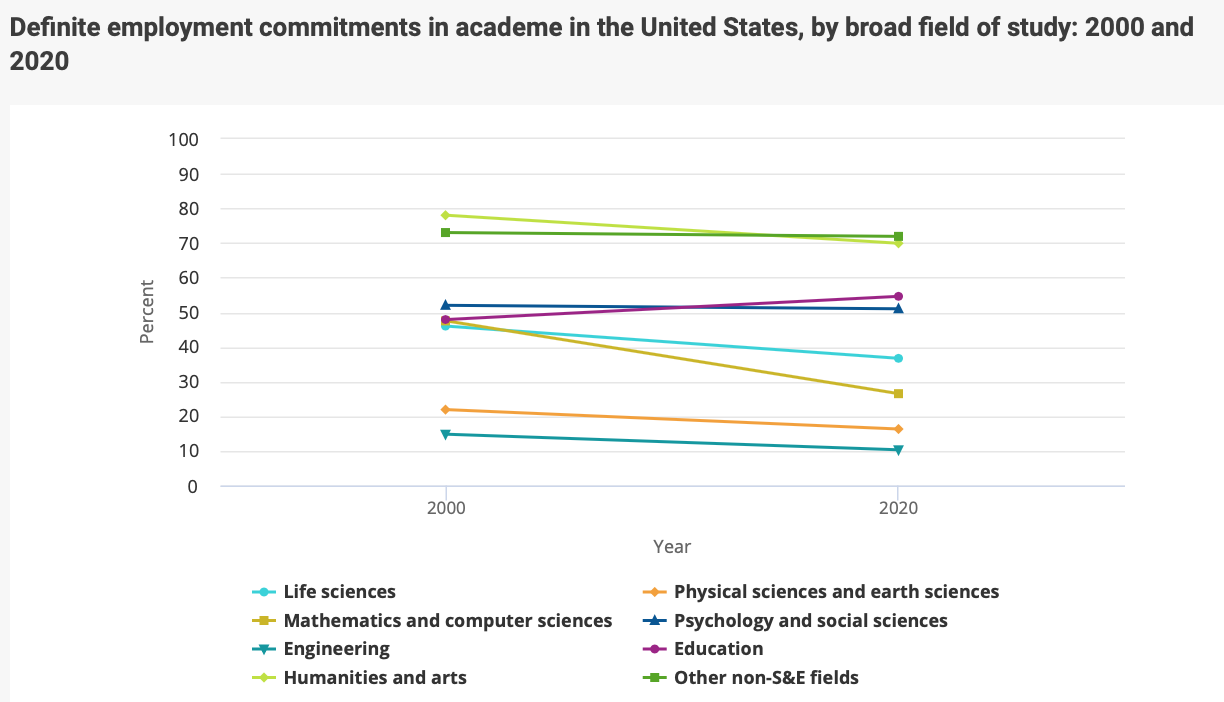
The academic job market has been poor for years now, and COVID-19 made it worse. The Survey of Earned Doctorates attempts to gauge new Ph.D.s’ employment prospects by asking about “definite commitments” for employment after graduation, and—despite COVID-19—it found that these commitments continued to increase across many broad science and engineering fields, following low points from 2014 to 2016. Over all, in 2020, 70 percent of doctorate recipients reported having definite commitments for employment or postdoctoral study. This includes jobs outside academe. The share of doctorate recipients in the life sciences, math and computer science who reported definite employment commitments was flat between 2019 and 2020, however
Continuing another long-standing trend across fields of study, new Ph.D.s’ median expected salary in industry or business was higher than salaries for those committing to postdoctoral positions or other jobs in academe. Median salaries for postdoctoral fellows in almost all broad fields were similar, ranging from $50,000 to $55,000. The exceptions were postdocs in math and computer science, with a median salary of $61,000.
Doctorate recipients in engineering were among those who reported the highest median academic salaries, at around $85,000. Ph.D.s in math and computer science reported the highest median salaries in industry or business positions, at about $144,000.
Some 73 percent of those on temporary visas intended to stay in the U.S. after graduating, up from about 69 percent in 2010. Among doctorate recipients on temporary visas with definite commitments to stay in the U.S. after graduation, more planned to work in industry or business than in academe.
 Interestingly, a greater proportion of U.S. citizens and permanent residents work in the academic sector than in industry or business.
Regarding student debt, 71 percent or more of Ph.D.s in science and engineering fields, excluding psychology and social sciences, said they held no graduate school debt. In psychology and social sciences, humanities and arts, and other non–natural science and engineering fields, half of Ph.D.s had this kind of debt. For education Ph.D.s, fewer than half had graduate school debt.
Robert Townsend, who studies trends in doctoral education as part of his job as program director for humanities, arts and culture at the American Academy of Arts and Sciences, said he wondered if the decline in degrees awarded was really significant, given that other federal data show small gains in every degree level for 2020. (Any differences between the NSF’s data and other numbers are based on differences in methodologies rather than error.)
From within the humanities “ecosystem,” at least, Townsend said, “the continuing decline in doctoral degrees is notable, though it seems modest relative to the depressed state of the academic job market.” Townsend said that based on his research, jobs ads placed with scholarly societies in the humanities are down more than 30 percent of late.
Another, “clearly positive” trend is the growing racial and ethnic diversity among those who are earning Ph.D.s in the humanities, Townsend said. The share is still “incredibly small relative to the population,” but it “rose above 20 percent among U.S. citizens and permanent residents earning humanities Ph.D.s for the first time in the [survey], so that is notable.”
Enyu Zhou, a senior analyst with the Council of Graduate Schools, said the council’s own data also show that the number of doctorate recipients declined in 2020. And while the overall majority of graduate students are women, Zhou said, they remain underrepresented in some science and engineering fields, such as engineering, math, computer science and physical and earth sciences.
The council doesn’t have its own data on doctorates awarded by race or citizenship, but its data on graduate enrollment trends show that first-time graduate enrollment among underrepresented minorities grew between 2019 and 2020. Underrepresented minority graduate students remain remain particularly underrepresented in science, engineering, technology and math, however, Zhou said. The council also found that international first-time enrollment and total enrollment—as opposed to degrees conferred—decreased in 2020. The broad fields of engineering, math and computer science were most affected.
“It’s interesting the [survey] found that the number of temporary visa holder doctorate recipients was similar to the number in 2019,” Zhou said, as this might imply that first-time international doctoral students were much more affected by the pandemic than continuing international doctoral students.