You have /5 articles left.
Sign up for a free account or log in.

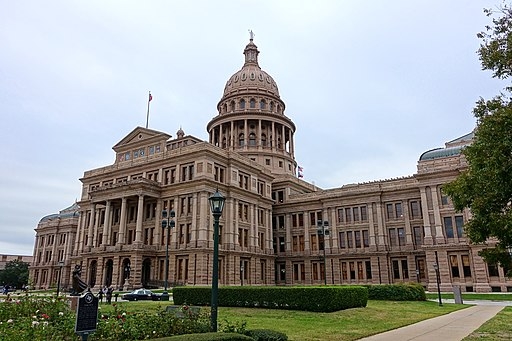
Texas’s spending on higher education shot up in 2024.
Daderot, CC0, via Wikimedia Commons
States collectively allocated $11.7 billion (or 10.2 percent) more for higher education in the 2024 fiscal year than they did in 2023, significantly outpacing the rate of inflation and more than compensating for the continuing decline in federal recovery funds distributed through state governments, initial data from the annual Grapevine study from the State Higher Education Executive Officers Association show.
The states spent a total of $126.452 billion in 2024, up from $114.734 billion in 2023. The figures provided by SHEEO are not adjusted for inflation, so the 10.2 percent increase represented by that change needs to be considered alongside an inflation rate that is expected to be near 3 percent in 2024. These data are preliminary, with some states reporting estimates rather than final figures.
Federal stimulus funds channeled to higher education through states dropped by about half from 2023 to 2024, from $1.635 billion to $801 million. Including the state-distributed stimulus funding, support for higher education grew by 9.4 percent from 2023.
Nineteen states increased their spending by at least 10 percent from 2023 to 2024, while nine states and the District of Columbia showed declines in spending.
Some of the states showing the largest funding increases are those where higher education has been under political scrutiny—and in some cases attack.
Florida spent 16.6 percent more on higher education in 2024 than in 2023, increasing its funding to $7.168 billion from $6.146 billion. Texas lifted its spending on higher education by a whopping 46 percent in 2024, but that included a one-time investment of $3 billion to create a new endowment for public universities.
Other states with increases of roughly 20 percent included Nevada (19.9 percent), New Mexico (19.2 percent), North Dakota (20.1 percent), South Carolina (24.2 percent) and Utah (21.8 percent).
State support for higher education declined by 12.3 percent in Vermont and by 8.7 percent in the much-larger Pennsylvania.
(Slide left and right to see the full table below)
| State | 2019 State Support | 2023 State + Stimulus | 2024 State + Stimulus | % Change, 2023 to 2024 |
|---|---|---|---|---|
| Alabama | 1,631,237,756 | 3,051,174,272 | 2,256,969,038 | -26.0% |
| Alaska | 352,493,923 | 319,785,930 | 337,577,435 | 5.6% |
| Arizona | 905,535,400 | 1,397,700,100 | 1,395,612,500 | -0.1% |
| Arkansas | 996,489,943 | 1,080,876,566 | 1,113,670,439 | 3.0% |
| Calif. | 15,435,163,945 | 20,472,263,422 | 21,672,255,309 | 5.9% |
| Colorado | 1,000,814,344 | 1,337,159,073 | 1,508,355,694 | 12.8% |
| Connecticut | 1,203,274,806 | 1,936,307,295 | 1,867,986,492 | -3.5% |
| Delaware | 247,384,870 | 275,748,870 | 284,350,568 | 3.1% |
| Florida | 5,376,596,509 | 6,146,368,404 | 7,167,947,469 | 16.6% |
| Georgia | 3,673,135,156 | 4,949,007,413 | 4,719,585,244 | -4.6% |
| Hawaii | 778,347,851 | 901,687,772 | 878,082,011 | -2.6% |
| Idaho | 506,520,681 | 659,311,439 | 702,089,300 | 6.5% |
| Illinois | 4,255,256,541 | 5,390,687,590 | 5,643,674,734 | 4.7% |
| Indiana | 1,849,459,088 | 1,915,994,324 | 2,026,685,482 | 5.8% |
| Iowa | 815,470,080 | 885,596,303 | 899,770,787 | 1.6% |
| Kansas | 806,027,217 | 1,008,945,356 | 1,131,734,797 | 12.2% |
| Kentucky | 1,156,701,400 | 1,484,046,289 | 1,444,278,289 | -2.7% |
| Louisiana | 1,177,144,207 | 1,478,999,745 | 1,648,469,509 | 11.5% |
| Maine | 308,450,738 | 390,424,176 | 395,913,701 | 1.4% |
| Maryland | 2,068,804,092 | 2,951,409,255 | 3,316,670,716 | 12.4% |
| Massachusetts | 1,664,231,299 | 2,186,641,057 | 2,546,803,171 | 16.5% |
| Michigan | 1,954,421,700 | 2,719,779,434 | 2,764,539,900 | 1.6% |
| Minnesota | 1,631,620,890 | 1,762,275,777 | 2,050,259,000 | 16.3% |
| Mississippi | 910,906,619 | 1,148,448,687 | 1,178,499,775 | 2.6% |
| Missouri | 998,983,910 | 1,232,756,172 | 1,296,467,325 | 5.2% |
| Montana | 244,579,818 | 285,811,303 | 301,375,108 | 5.4% |
| Nebraska | 762,533,014 | 901,587,028 | 896,939,918 | -0.5% |
| Nevada | 743,977,813 | 792,496,714 | 949,861,245 | 19.9% |
| New Hampshire | 133,314,642 | 157,220,748 | 177,597,572 | 13.0% |
| New Jersey | 2,273,200,000 | 2,853,751,000 | 3,176,019,000 | 11.3% |
| New Mexico | 868,610,800 | 1,230,814,300 | 1,467,290,200 | 19.2% |
| New York | 6,114,537,039 | 6,291,499,786 | 6,664,213,954 | 5.9% |
| North Carolina | 4,317,975,609 | 5,232,545,093 | 5,375,927,838 | 2.7% |
| North Dakota | 358,491,256 | 391,393,275 | 470,036,099 | 20.1% |
| Ohio | 2,297,931,327 | 2,466,603,626 | 2,744,759,776 | 11.3% |
| Oklahoma | 908,516,745 | 993,743,064 | 1,145,070,360 | 15.2% |
| Oregon | 894,489,883 | 1,154,822,540 | 1,239,897,707 | 7.4% |
| Pennsylvania | 1,760,283,703 | 2,241,041,832 | 2,046,596,295 | -8.7% |
| Rhode Island | 197,034,373 | 230,904,102 | 252,529,535 | 9.4% |
| South Carolina | 1,137,336,753 | 1,499,871,871 | 1,863,455,120 | 24.2% |
| South Dakota | 243,284,466 | 319,955,552 | 334,742,907 | 4.6% |
| Tennessee | 2,036,136,587 | 2,803,826,948 | 2,912,690,494 | 3.9% |
| Texas | 7,789,549,519 | 9,385,138,564 | 13,773,936,696 | 46.8% |
| Utah | 1,113,971,200 | 1,533,006,700 | 1,866,968,800 | 21.8% |
| Vermont | 92,436,355 | 154,279,232 | 135,226,632 | -12.3% |
| Virginia | 2,121,187,648 | 3,033,117,888 | 3,400,015,383 | 12.1% |
| Washington | 2,037,559,000 | 2,614,648,320 | 2,937,608,465 | 12.4% |
| West Virginia | 491,888,995 | 555,216,054 | 560,719,333 | 1.0% |
| Wisconsin | 1,573,280,133 | 1,784,433,014 | 1,901,389,601 | 6.6% |
| Wyoming | 399,063,271 | 362,375,229 | 410,566,282 | 13.3% |
| U.S. | 92,615,642,914 | 116,353,498,504 | 127,253,683,005 | 9.4% |
| D.C. | 99,066,770 | 136,580,302 | 124,422,250 | -8.9% |


