You have /5 articles left.
Sign up for a free account or log in.

Getting administrators, faculty and staff members to speak the language of student success data is of course easier said than done. One thing that’s helped the University of Kentucky adopt that common tongue? Holding weekly, open-door data meetings focused on retention.
University of Kentucky
Back in 2016, the University of Kentucky doubled down on student success as a strategic goal. The commitment involved a realignment of resources toward the four main reasons the university has found that students persist, or don’t: academic preparation, mental and physical well-being, financial stability, and sense of belonging and community.
As part of this restructuring, UK officials also rethought student communication strategies, prioritizing deliberate, multimodal communication, and worked toward building a culture of care.
Lastly, leaders wanted data analytics—and a related culture of evidence— to guide much of their work. But getting administrators, faculty and staff members to speak student success data is of course easier said than done. One thing that’s helped UK adopt that common language? Holding weekly, open-door data meetings focused on retention.
Todd Brann, executive director of institutional research, analytics and decision support at UK, calls these meetings the “secret sauce” to the university’s success thus far.
Process and purpose: Originally attracting about 10 attendees, the meetings now draw scores from across departments, offices and programs.
Attendees help contextualize and identify barriers to success from the billions of student data points that Brann and his colleagues collect from various university platforms. This process can work in reverse, too: Sometimes meeting attendees share on-the-ground problems or anecdotes and then look to the data for larger patterns or explanations.
Either way, the real purpose of the meeting is to brainstorm data-based interventions and solutions.
“We’re creating a space where folks can ask questions about the data, get interested in the data, and then we come back the next week and we close the loop and we provide answers,” Brann says. “And we’re going to prioritize those data points that can actually lead to an action.” Example: One year, a dip in priority registration among first-year women tipped student success leaders off to a conflict within a particular social club, and interventions were arranged.
Why it helps: Kirsten Turner, vice president for student success and chief student affairs officer, says the meetings are particularly helpful in democratizing and speeding up problem-solving.
“A lot of times in higher ed, somebody identifies a problem and it’s got to go up the chain of command—you’ve got to wait for the meeting, you’ve got to talk to somebody, then you’ve got to find funding, and then it’s got to come back down the chain of command. All of that takes weeks. And we need to be able to pivot and do interventions in real time.”
She adds, “[Brann] always says, ‘The data are screaming at us, if we want to listen to it.’”
Who’s invited (and who shows up): All faculty and staff members with a specific interest in student success. Average attendance is 60 to 80 people. Data analysts, the dean of students and personnel from information technology, academic and program advising, tutoring and academic support, residence life, public relations and marking, student account services, and financial aid are especially well represented.
How it works: Meeting leaders start with a weekly slide deck to review highlighted data, gathering input and questions. Actionable items and updates from campus partners follow. The meeting ends with a strategic communication plan, calendar for student communications and a summary of action items. At a recent convening, discussion centered on the university’s predictive student success model, updated after fall grades, and how to work with opportunity students who are first generation; the model currently suggests that these students are most at risk of not retaining next fall.
When and where it happens: Every Friday from 10:00 to 11:30 a.m., in person. More than 300 campus partners are included in a forum for the meeting on the university’s learning management system, but there is no Zoom option, as leaders emphasize in-person attendance. As for meeting venue, leaders chose a central location on campus, currently in a classroom in the Gatton College of Business and Economics building.
The impact: Brann, Turner and colleagues believe that by focusing on current data and analytics for first-time students and linking that information to specific action items, they’ll be able to align finite resources with the students who need them most to succeed at a higher rate.
UK’s ever-growing culture of evidence has contributed to student success gains, including increased retention, Turner says. The university’s first-to-second-year retention rate is now 87 percent, up from about 80 percent in 2016, while the six-year graduation rate is 70 percent, up from 60 percent. Over the same period, UK has increased the student population but not selectivity, to stay true to the university’s land-grant mission.
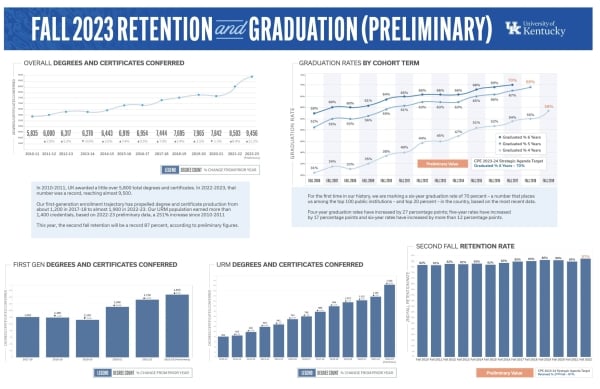
The University of Kentucky’s Institutional Research, Analytics and Decisions Support division tracks key student success metrics, such as the fall 2023 retention numbers, and shares them at weekly data meetings focused on retention.
“We represent a state that has challenges. We believe that our goal is to advance Kentucky, and that in order to do that we have to get more students with a UK degree,” Turner says.
Five Practical Data Meeting Pointers
Jillian Kinzie, associate director of the National Survey of Student Engagement at Indiana University at Bloomington’s School of Education, argues in her own student success data outreach that higher education institutions are “data rich,” with information about enrollment, credit hours earned, retention, teaching and learning, advising, outcomes, and more. Yet institutions must adopt strategies to “connect the dots,” finding ways to combine and “relate” the data to create a more complete picture of student success.
Here are Kinzie’s five student success data team pointers:
- The question “How does data about undergraduate student experiences help us be smarter about student success?” should animate all student success efforts. Kinzie credits this to the late Susan Whealler Johnston, president and CEO of the National Association of College and University Business Officers.
- Data teams should not be in the business of “mindlessly tracking metrics, or routinely collecting data disconnected from meaningful questions about student success.” Instead, teams should “initiate and sustain their work with meaningful questions that campus audiences are interested in understanding. Data should be compiled and presented as a reply to these questions.”
- Student success data must include aggregate and disaggregated measures and be explored through an equity lens. Kinzie cites a variety of inclusive quantitative and qualitative methodologies, including person-centered approaches, culturally responsive evaluation, critical methodologies and community-based participatory research and valuing rich data from small populations.
- Student success data “should carry a heavy expectation for action to improve.” Units and departments must be held accountable for acting on data and demonstrating continuous improvement to meet today’s students’ needs and eliminate inequitable outcomes.
- Ask, “Do we have good enough knowledge to try something different that might benefit our students?” A variety of trade-offs and methodological constraints make some analyses imperfect, “so don’t stall action.” Blend “good enough” data with professional wisdom and action to improve practice and enact change.
Today’s adage that “student success is everyone’s responsibility” makes it essential to foster broad student success data knowledge, Kinzie adds. Success teams representing a broad variety of campus perspectives and voices—including students—can meet regularly under the direction of a student success vice president or similar leader and then be empowered to foster a culture of evidence within their own academic or program units.
“These days, there’s simply too much information readily available about students’ experience and their success to not take advantage of it to monitor, derive insights about what’s working and for whom and inform action,” she says. “Routine data at the institution, program and course levels—including semester-to-semester retention, grades in gateway courses, learning analytics, student engagement survey and climate results, student involvement levels, advising visit rates, among others, should be tapped for insights about what needs attention. Student success efforts must be centered on data.”
How is your institution making student success decisions grounded in evidence? Share your approach and your best tip for successful data meetings.