You have /5 articles left.
Sign up for a free account or log in.
Enrollments got a big boost this fall, upending predictions and reversing the erroneous findings of a preliminary report.
Photo illustration by Justin Morrison/Inside Higher Ed | tiero/iStock/Getty Images
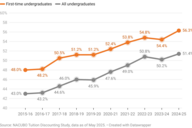
Postsecondary enrollment is up 4.5 percent this year, bringing the combined number of undergraduate and graduate students above 2019 numbers for the first time since the COVID-19 pandemic, according to a new report from the National Student Clearinghouse Research Center.
Undergraduate enrollment rose by 4.7 percent, though it remains 1 percent below 2019 levels. First-year undergraduate enrollment slightly surpassed pre-pandemic levels for the first time, rising by 5.5 percent.
It’s a long-awaited milestone, reached after years of sluggish post-pandemic recovery, that undermines predictions of enrollment decline due to the bungled rollout of a new Free Application for Federal Student Aid and mounting demographic challenges across the country.
But more than a return to the status quo, the numbers suggest a new landscape taking shape. Much of this fall’s recovery was powered by a rapid boost in alternative credential and certificate programs, which the report shows are up nearly 10 percent year over year and 28.9 percent since 2019. Meanwhile, enrollment in bachelor’s degree programs increased only 2.9 percent, and associate programs by 6.3 percent; both remain significantly below 2019 levels. NSC executive research director Doug Shapiro said community colleges saw the most growth in vocational-focused degree pathways.
The “Current Term Enrollment” report’s largely positive findings run contrary to the clearinghouse’s preliminary report from October, which found that first-year enrollment had dropped 5 percent. On Jan. 13, clearinghouse researchers said they’d discovered a methodological error in the October report—and in every prior preliminary report going back to their start in 2020—that significantly skewed the first-year data. Shapiro said the error did not impact this week’s report.
Discrepancies between the early report and the January edition are not uncommon, considering the former includes data from only about half of higher ed institutions while the latter includes “the vast majority” of institutions, Shapiro said. But this year the difference was 10 percentage points, far greater than ever before. The preliminary report also said first-year enrollment at community colleges had fallen by 1.7 percent when it actually rose by 7 percent.
In an interview with Inside Higher Ed earlier this week, clearinghouse CEO Ricardo Torres said the organization was conducting an internal review of its methodologies and considering eliminating the preliminary enrollment report entirely.
The error also affected the last two iterations of the “Transfer and Progress” report, a spokesperson told Inside Higher Ed on Tuesday; a new transfer report using corrected methodology is set for release next month. And it skewed the data for a one-time special report released last month, which said 18-year-old enrollment fell by 5 percent; the new report found that it actually increased by 3.4 percent.
At a press briefing on the new report Wednesday, Shapiro said the research center is still reviewing other reports to determine if any more were affected.
For-profit colleges experienced the strongest enrollment growth of any institution type, according to the report, at 7.4 percent. Community colleges were next at 6 percent—a much higher jump than last year, though they’re still 5 percent below pre-pandemic levels. Public four-year enrollment grew by 3.1 percent, bringing it above 2019 levels for the first time. And enrollment at private, nonprofit institutions, which recovered from the pandemic decline years ago, grew by 3.8 percent.
In addition, the report found that 50 percent more students declined to report their racial identity in fall 2024 than the previous year. The surge is likely a result of the Supreme Court’s 2023 affirmative action ban and tracks with an Inside Higher Ed analysis of application data at selective colleges, most of which reported double or triple the number of students choosing not to report race.
Other significant findings in the report include:
- A 1 percent bump in white enrollment, the first increase since 2019.
- Black and Hispanic enrollment grew 6.8 percent each, the largest increases since 2019.
- HBCU enrollment grew by 3.8 percent.
- Enrollment rose far more at less selective universities (5.2 percent) than highly selective ones (0.6 percent).
- Bucking demographic trends, enrollment in the Northeast rose by 4.7 percent, matching growth in the South and West. It’s the first time in five years enrollments have increased in the region.
- Enrollment rose in every state except for Vermont and Nebraska, where it fell by less than 1 percent in both cases.
Subverting Expectations
When the clearinghouse released its erroneous preliminary report, the finding of a 5 percent drop in first-year enrollment upset but didn’t necessarily surprise many higher ed professionals: 2024 had been a difficult year, and the botched FAFSA rollout, combined with the arrival of the long-awaited demographic cliff, had primed them for bad news. But the new report’s corrected findings could upend the sector’s understanding of the enrollment landscape.
So how did things turn out so differently than expected? The Education Department seemed to predict the uptick last fall when officials noted that changes in aid eligibility calculations on the new FAFSA had resulted in a 5 percent increase in students receiving federal aid and a whopping 14 percent increase in Pell Grant recipients.
The new report’s data seems to support a connection between the expansion of federal aid eligibility and rising enrollment. Enrollment from the lowest-income neighborhoods rose by 7.3 percent after two straight years of modest 2 percent growth, and growth was strongest at community colleges and less selective institutions, which tend to serve more low-income students.
Bill DeBaun, senior director of data and strategic initiatives at the National College Attainment Network, said this is the first year since he started tracking FAFSA completion rates in 2017 that enrollments went in the opposite direction.
“It’s notable that the biggest enrollment increase by far for these freshmen is at community colleges,” he said. “It may be that high school seniors who did not complete the FAFSA or who had their awards delayed decided to enroll at community colleges, where tuition would be most affordable.”
Shapiro said expectations of a coming decline were so widespread—and FAFSA completion numbers and early institutional data seemed to so strongly indicate one—that it clouded NSC researchers’ ability to spot the glaring error in the preliminary October report before its release.
“I think our sensitivity to abnormally large changes was somewhat reduced last year, because we had a host of ready explanations for why we might be seeing these declines,” Shapiro said. “It would have surprised us in a normal year, but all the things we believed could be driving a change kind of dulled our sensors.”
More Details on the Data Error
In response to a question from Inside Higher Ed, Shapiro shed more light on what went wrong with the preliminary report and how researchers discovered an error that flew under the radar for four years.
“As we were producing the numbers for ‘Current Term Enrollment Estimates,’ we saw that 10.5 percent swing in the numbers from negative to positive … We asked, ‘How could this be?’” he said. “As we drilled down, it became apparent that this was far in excess of what we would expect from a random sampling error.”
Shapiro explained that institutions’ self-reported data does not differentiate between first-year and dual-enrolled students, but lumps them together. The clearinghouse separates them out by making assumptions based on other data it has access to—namely students’ ages, inferring that any first-year students under 18 are dually enrolled. The research team then augments the findings with data on high school diploma attainment, which Shapiro said usually helps reduce the number of miscounts by allowing them to pinpoint when, or whether, a 17-year-old student has graduated from high school.
“What we discovered is that this method is not consistent over time and regularly adjusts the numbers for prior years more effectively than the current year,” he said. “When you’re focused on percent change year over year, that results in an incorrect number.”
The “Current Term Enrollment” report normally separates out dual-enrolled students, but this report did not. Instead it includes a breakdown of students 17 and under, which NSCRC senior research associate Jennifer Causey said should be representative of dual-enrolled students—they are still imputing, she said, based on age data. Enrollment in that group rose by 10.2 percent, the largest jump since 2022 and double last year’s growth.
While most of the 17-and-under growth occurred at community colleges, four-year institutions saw a significant boost as well, illustrating the rapid adoption of dual-enrollment programs across higher ed in the past year. Enrollment for students 17 and under grew by 16.7 percent at private nonprofit colleges and by 11.6 percent at public four-years.
Shapiro said the January reports will always be more accurate than the preliminary enrollment reports, even without methodological errors.
“The October reports are as real-time as it gets; that is preliminary data,” he said. “We’ve always cautioned that those numbers are likely to change as more data comes in.”