You have /5 articles left.
Sign up for a free account or log in.
2018 NACUBO-TIAA Study of Endowments
Just under half of all spending from endowments goes to supporting student financial aid, according to data included for the first time in an annual survey of college and university endowments.
Now the question is whether that’s high or low -- and whether it provides any meaningful insight into colleges’ and universities’ priorities.
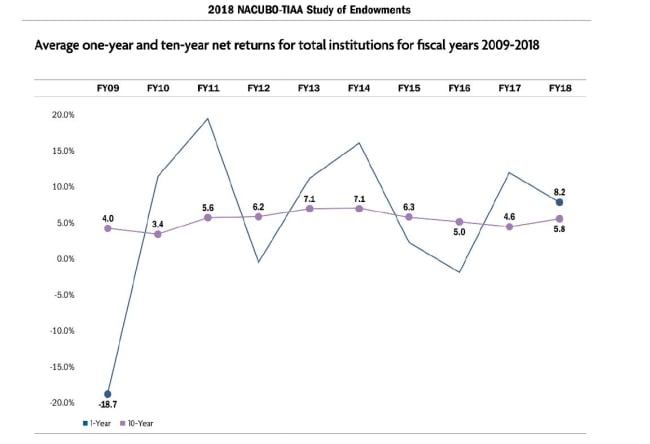
The annual study of endowments, released today by the National Association of College and University Business Officers and the financial services company TIAA, includes the headline finding that endowment returns fell by about a third to 8.2 percent, net of fees, for the year ending in June 2018. That rate lifted the 10-year average return to 5.8 percent, which falls short of a 7.2 percent target set to keep endowments' purchasing power intact in the face of spending and the cost of inflation over time.
But this year's survey also includes an enticing bit of data about how colleges and universities spend the money their endowments generate. On average, 49 percent of total endowment withdrawals go toward student scholarships and financial aid programs. Another 16 percent of endowment spending goes toward supporting academic programs, 10 percent supports faculty positions and 7 percent supports campus operations.
The remaining 18 percent falls under a category covering all other purposes. It would include any number of functions, like hospital operations, patient health care or community services.
In the past, the survey has not included information on how institutions allocate the money they spend from their endowments. And the data released today didn’t include much in the way of context.
NACUBO doesn’t have previous years of data on where spending goes, making it impossible to compare this year’s numbers against the past. The business officers’ association didn’t give survey participants specific definitions for each spending category, meaning respondents reported spending by categories based on what they felt was the best fit, so accounting could differ from institution to institution.
A NACUBO researcher said an analysis breaking down spending destinations by endowment size won’t be possible before a full report is released in March. Differences in the way institutions may have interpreted the question and in the number of institutions in each size segment that answered the question would make an apples-to-apples comparison difficult.
The only information the association would release was that, in general, institutions with larger endowments tended to report dedicating lower percentages of their endowment spending to financial aid than those with smaller endowments. But those wealthier institutions still spend more on financial aid when measured in dollars, because their endowments generate so much more money.
“This is not a surprise once you consider that schools with big endowments tend to have a greater number of endowed chairs/faculty research slots, while schools with smaller endowments tend to have fewer endowed chairs,” said Ken Redd, NACUBO senior director of research and policy analysis, in an email. “But this general sense cannot yet be proven with the data we have, given the possible effects of non-response bias once we try to generate statistics by endowment sizes.”
Nonetheless, NACUBO clearly thought the spending information was important -- it was the fourth of 14 slides in a presentation for reporters. In addition, the question of how colleges and universities spend the money generated by their endowments has grown more and more politically contentious, with the issue coming to a head about a year ago when Republicans passed a tax reform package that included a tax on endowment earnings at the wealthiest institutions.
Higher education associations and wealthy institutions have fought desperately against the tax, saying endowments represent a significant source of revenue and that students gain the most from the financial resources.
“In fact, across our institutions, endowments support a significant and growing portion of our operations; for many, endowments provide almost half of annual revenues,” read one letter that 49 wealthy institutions sent last year to congressional leaders. “Students are the leading beneficiary of these resources with each of us committed to significant efforts to enhance affordability.”
Yet a large-scale accounting of how colleges are spending their endowment earnings has remained elusive. Individual cases have cropped up over the years providing insight into how much endowment spending is going to student aid at some colleges and universities, but a wider look at spending across hundreds of institutions remains conspicuously absent.
“There’s no good guidance on how much money colleges have in their endowments for different functions and then how they choose to use the dollars that are unrestricted,” said Robert Kelchen, an assistant professor of higher education at Seton Hall University.
The new study addresses that question only up to a point. It includes survey responses from 802 colleges and universities. But it doesn’t get into key details that would shed light on institutional priorities. It’s not clear how much money being spent on student aid is need based or non-need based. Also unclear is how much of the spending on student aid -- or any other category -- comes from unrestricted funds and how much is required to be spent in certain ways because of agreements with donors.
As a result, higher ed experts and economists weren’t sure how to categorize the statistic.
It is “eye-catching” but “practically meaningless,” said Jonathan Meer, a professor at Texas A&M University who researches charitable giving and the economics of education.
Finding the percentage of institutions' total expenditures devoted to financial aid would be more meaningful than focusing on endowments, said Charles Clotfelter, a professor of economics and law at Duke University, in another email. Money collected from endowments has the same ability to pay for scholarships as money from other sources, like state appropriations or tuition, he added. So endowment spending alone isn’t a full picture of college and university priorities.
The 49 percent number is highly confusing, said Art Hauptman, an independent public policy consultant who specializes in higher education finance. Institutions with large endowments likely use more money to keep the sticker price of tuition lower than the cost of educating their students, while not dedicating nearly as much toward financial aid that would buy down the sticker price students pay. Most private institutions don’t have substantial endowments, though, so the bulk of the student aid they provide comes in the form of discounts off their sticker prices.
Only 10 percent of spending going to endowed chairs across the higher education sector also seems low, he said.
“On the other hand, if it is really true that half of endowment income (and annual gifts?) is used for financial aid, that is a scary thought,” Hauptman said in an email. “That would mean that institutions are being incredibly aggressive in their pricing -- usually virtually nothing to keep tuition below spending per student -- and that any increase in tuition gets eaten up almost entirely by financial aid.”
Advocates for spending more on financial aid for low-income students agreed more context is necessary.
“To some extent, we know that higher numbers are probably better than lower numbers,” said Andrew Nichols, senior director of higher education research and data analytics at the Education Trust, who co-wrote a 2016 report arguing that small changes in endowment spending at wealthy institutions could significantly increase aid for low-income students.
“I think it’s difficult to say in aggregate what it means,” he said of the NACUBO spending data. “It would be easier to tell if we were looking at institutional data and were able to see what other outcomes were.”
NACUBO and TIAA leaders thought the statistic meant something. They said in a conference call with reporters that the 49 percent figure shows colleges and universities are dedicated to student affordability.
“This was the largest single area of endowment spending as reported by survey participants,” said Susan Whealler Johnston, NACUBO’s president and chief executive officer. “This underscores the essential nature of endowments to student access and success as well as to college and university long-term planning and goals.”
Returns Fall in the Short Term, Rise in the Long Term
The annual endowment study’s primary focus has not been on how endowments spend, of course. It’s been what they earn, how they invest and how they’ve grown.
On those points, the study shows endowments posting a strong fiscal year in 2018 -- but not as strong as in 2017. Returns also weren’t high enough to keep endowment watchers comfortable that the funds will be able to maintain their spending power over the long term.
Breaking the data down further shows a continuing divergence between the wealthiest institutions and everyone else. The rich have been getting richer faster, earning more on their investments in the process.
The 802 colleges and universities taking part in the study reported endowment returns averaging 8.2 percent, net of fees, for the fiscal year that ended in June 2018. That was down from 12.2 percent for the 2017 fiscal year but still much higher than -1.9 percent in 2016.
Lower performance in U.S. and international equity markets depressed endowment returns in the most recent year. U.S. equities returned 13.6 percent in 2018, down from 17.6 percent the previous year. Non-U.S. equities returned 6.8 percent after previously returning 20.2 percent.
Two other asset classes also returned less in 2018 than in 2017. Fixed income returned just half a percentage point after returning 2.4 percent in 2017. Short-term securities, cash and other investments returned 1.3 percent, down slightly from 1.4 percent the year before.
Only one asset class saw better returns in 2018 than in the year before: alternative strategies. The broad asset class, which includes investments like hedge funds, private equity, noncampus real estate, distressed debt and commodities, returned 8.3 percent. That was up from 7.8 percent in 2017.
The largest endowments invest much more heavily than others in alternative strategies. While parts of the asset class have struggled, some segments, like private equity and venture capital, have offered the potential for greater return.
Therefore, it’s no shock that large endowments posted the best performance in 2018 when endowments are broken down by size.
“The overwhelming trend is still the larger the endowment, the easier it is to outperform,” said Kevin O’Leary, chief executive officer of TIAA Endowment and Philanthropic Services, during the conference call.
Endowments with assets of over $1 billion returned 9.7 percent -- a full percentage point higher than the next best return when endowments were broken down by size.
| All Institutions | 8.2 |
|---|---|
| Over $1 billion | 9.7 |
| $501 million to $1 billion | 8.7 |
| $251 million to $500 million | 8.5 |
| $101 million to $250 million | 7.9 |
| $51 million to $100 million | 7.7 |
| $25 million to $50 million | 7.5 |
| Under $25 million | 7.6 |
Larger endowments have outperformed smaller endowments over time, including over spans when alternative strategies did not perform as well as some other asset classes. In part, this could be because smaller endowments generally put more into fixed-income investments, which are considered less risky than other types of investments that may have more upside.
More important to college and university endowments than returns for a single year is how they are performing over time. The average three-year net annualized return across institutions for the period ending in 2018 came in at 6.2 percent. For five years, it was 7.3 percent.
And the average 10-year net annualized return -- perhaps the most important as colleges and universities look at long-term performance while setting spending rates -- notched 5.8 percent.
Last year, the 10-year return was 4.6 percent. This year’s 10-year average rose in large part because the year that dropped off, 2008, was a year of poor returns. Endowments returned -3 percent on average that year.
That dynamic could be good news for next year’s 10-year average. The 2009 fiscal year, which covers the depths of the Great Recession, saw net endowment returns plunge to -18.7 percent. When that negative number drops from the 10-year average next year, the metric will likely look better than it does today.
| 3-year | 5-year | 10-year | |
|---|---|---|---|
| All Institutions | 6.2 | 7.3 | 5.8 |
| Over $1 billion | 6.8 | 8.2 | 6.0 |
| $501 million to $1 billion | 6.2 | 7.4 | 5.6 |
| $251 million to $500 million | 6.1 | 7.3 | 5.7 |
| $101 million to $250 million | 6.0 | 7.1 | 5.6 |
| $51 million to $100 million | 6.0 | 7.0 | 5.7 |
| $25 million to $50 million | 6.0 | 7.0 | 6.1 |
| Under $25 million | 6.2 | 7.5 | 5.8 |
The fact remains the 10-year marker stands at 5.8 percent currently. The number concerns O’Leary because it’s below a 7.2 percent targeted rate of return endowments should earn over time to cover their average spending and inflation.
“The average return was not able to crest the long-term return objective at any time in the last decade,” he said. “Further, if you believe that we are entering into a rising interest rate environment, the long-term return objective should increase with those rates in inflation. This headwind will make it even more challenging for schools to hit their targets, especially considering increases in endowment spending.”
Other Findings
Two-thirds of colleges and universities in the study increased endowment spending, and the median increase was 6.6 percent. Spending increases outpaced the rate of inflation, which was 2.8 percent according to the Higher Education Price Index. Endowments are now funding 10 percent of an institution’s operating budget, on average.
The average is likely skewed by a small number of large endowments, however. Harvard and Yale, which have the two largest endowments among private universities, use endowment spending to cover more than a third of their budgets, for example.
Meanwhile, endowments’ average effective spending rate didn’t change between 2017 and 2018. The effective spending rate is the distribution marked for spending divided by the endowment market value at the beginning of the fiscal year. It clocked in at 4.4 percent across all institutions and has not risen higher than 4.6 percent in a decade.
The largest endowments reported higher effective spending rates than endowments of most other sizes, with one exception. Endowments of more than $1 billion had an effective spending rate of 4.6 percent, matched only by endowments with between $51 million and $100 million in assets.
One notable difference between the two groups: endowments with more than $1 billion spent 4.6 percent after ticking down by two-tenths of a percent from the previous year, while those with $51 million to $100 million hit the mark after inching up by one-tenth of a point.
| Size of Endowment | 2018 | 2017 |
|---|---|---|
| All Institutions | 4.4 | 4.4 |
| Over $1 billion | 4.6 | 4.8 |
| $501 million to $1 billion | 4.2 | 4.6 |
| $251 million to $500 million | 4.4 | 4.4 |
| $101 million to $250 million | 4.4 | 4.6 |
| $51 million to $100 million | 4.6 | 4.5 |
| $25 million to $50 million | 4.1 | 4.2 |
| Under $25 million | 4.1 | 4.0 |
Public institutions reported lower annual effective spending rates than private institutions, 3.8 percent versus 4.7 percent.
Just over three-quarters of respondents, 76 percent, grew the real value of their endowments in the 2018 fiscal year, largely because of positive market returns. New gifts also contributed to endowment sizes, totaling $9.9 billion among survey participants.
The median gift level rose from $3.2 million in 2017 to $3.7 million in 2018.
Public institutions had a higher median gift value than private institutions, $5 million versus $3.1 million. Gifts ranged in size much more widely when looking at institutions by their wealth levels. The median gift at small institutions was $376,000. At institutions with more than $1 billion in endowment assets, the median gift was more than $50 million.
The 802 colleges and universities taking part in this year’s study held a total of $616.5 billion in endowed assets. The median endowment was about $140.2 million, but that’s skewed upward by large endowments at the top. A significant portion of study participants, 41 percent, held endowments of $101 million or less. And 9.1 percent had endowments valued under $25 million.
| Size of Endowment | Number of Respondents | Percent of Total | Total Endowment Value (in 000s) | Percent of Total |
|---|---|---|---|---|
| Total (All Institutions) | 802 | 100 | $616,525,591 | 100 |
| Over $1 billion | 104 | 13.0 | 474,167,902 | 76.9 |
| $501 million to $1 billion | 85 | 10.6 | 62,402,093 | 10.1 |
| $251 million to $500 million | 88 | 11.0 | 31,501,369 | 5.1 |
| $101 million to $250 million | 195 | 24.3 | 31,879,088 | 5.2 |
| $51 million to $100 million | 154 | 19.2 | 11,491,008 | 1.9 |
| $25 million to $50 million | 103 | 12.8 | 3,899,779 | 0.6 |
| Under $25 million | 73 | 9.1 | 1,184,352 | 0.2 |
A total of 104 participants, or 13 percent of the entire pool, counted endowments totaling more than $1 billion. They held a whopping $474.2 billion -- 76.9 percent of all endowed assets covered by the study.
The top 10 largest endowments held a total of $217.7 billion -- 35 percent of the total assets covered by the study. The largest endowment in the country, Harvard, had $38.3 billion -- 6 percent of all assets covered in the study.
Looking at public versus private institutions produced splits that were much more in line with what could be expected if institutional share were to equal share of total assets. Public institutions made up 37.9 percent of the total survey pool and held 33.2 percent of all assets -- $203.8 billion. Private colleges and universities were 62.1 percent of the pool and held 66.8 percent of assets.
Below are the 25 largest endowments in the country and their change in size between 2017 and 2018. The change in size is not the rate of return referenced throughout the article above. Instead, it includes net changes from withdrawals, management and investment fees, gifts and investment gains or losses.
| Institution | FY18 Endowment Funds (in 000s) | FY17 Endowment Funds (in 000s) | Change in Market Value (percent) |
|---|---|---|---|
| Harvard University | $38,303,383 | $36,021,516 | 6.3 |
| University of Texas System | 30,886,018 | 26,535,095 | 16.4 |
| Yale University | 29,351,100 | 27,176,100 | 8.0 |
| Stanford University | 26,464,912 | 24,784,943 | 6.8 |
| Princeton University | 25,917,199 | 23,812,241 | 8.8 |
| Massachusetts Institute of Technology | 16,529,432 | 14,967,983 | 10.4 |
| University of Pennsylvania | 13,777,441 | 12,213,202 | 12.8 |
| Texas A&M University System and Foundations | 13,524,947 | 11,556,260 | 17.0 |
| University of Michigan | 11,901,760 | 10,936,014 | 8.8 |
| Northwestern University | 11,087,659 | 10,436,692 | 6.2 |
| University of California | 11,008,035 | 9,638,705 | 14.2 |
| Columbia University | 10,869,245 | 9,996,596 | 8.7 |
| University of Notre Dame | 10,727,653 | 9,352,376 | 14.7 |
| Duke University | 8,524,846 | 7,911,175 | 7.8 |
| University of Chicago | 7,928,485 | 7,523,720 | 5.4 |
| Washington University in St. Louis | 7,594,159 | 7,130,514 | 6.5 |
| Emory University | 7,292,165 | 6,905,465 | 5.6 |
| Cornell University | 7,230,291 | 6,757,750 | 7.0 |
| University of Virginia | 6,953,380 | 6,393,561 | 8.8 |
| Rice University | 6,277,506 | 5,814,444 | 8.0 |
| University of Southern California | 5,544,267 | 5,130,520 | 8.1 |
| Dartmouth College | 5,494,203 | 4,956,494 | 10.8 |
| Ohio State University | 5,211,434 | 4,253,459 | 22.5 |
| Vanderbilt University | 4,608,461 | 4,136,465 | 11.4 |
| Johns Hopkins University | 4,325,020 | 3,844,918 | 12.5 |