You have /5 articles left.
Sign up for a free account or log in.
State-funded student financial aid increased by about 6 percent across the country in the 2014-15 academic year as states put more money into grant and nongrant programs alike, according to the latest round of an annual survey released Monday.
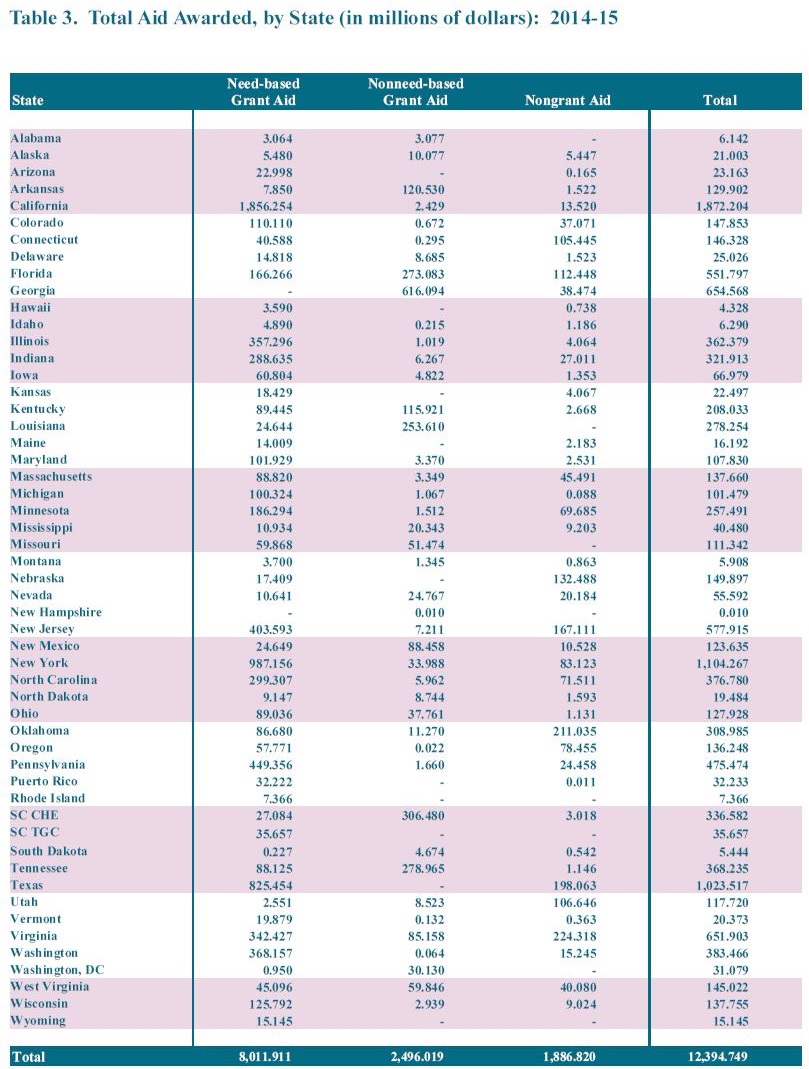
States funded and awarded about $12.4 billion in total student financial aid, according to the 46th annual survey from the National Association of State Student Grant and Aid Programs. That’s up 6 percent nominally and 5.8 percent adjusting for inflation. It’s also higher than the rate of growth reported in NASSGAP’s survey for the previous academic year, which found that total aid grew by an adjusted 1.6 percent, to $11.7 billion.
Both grant and nongrant student aid grew in 2014-15, the new survey found. Nongrant student aid, which includes loans, loan assumptions, conditional grants, work-study and tuition waivers, rose by more than 7 percent to $1.9 billion. But grants continued to account for the vast majority of student aid -- almost 85 percent.
Grants grew to about $10.5 billion, up 5.7 percent. States made nearly 4.5 million grant awards.
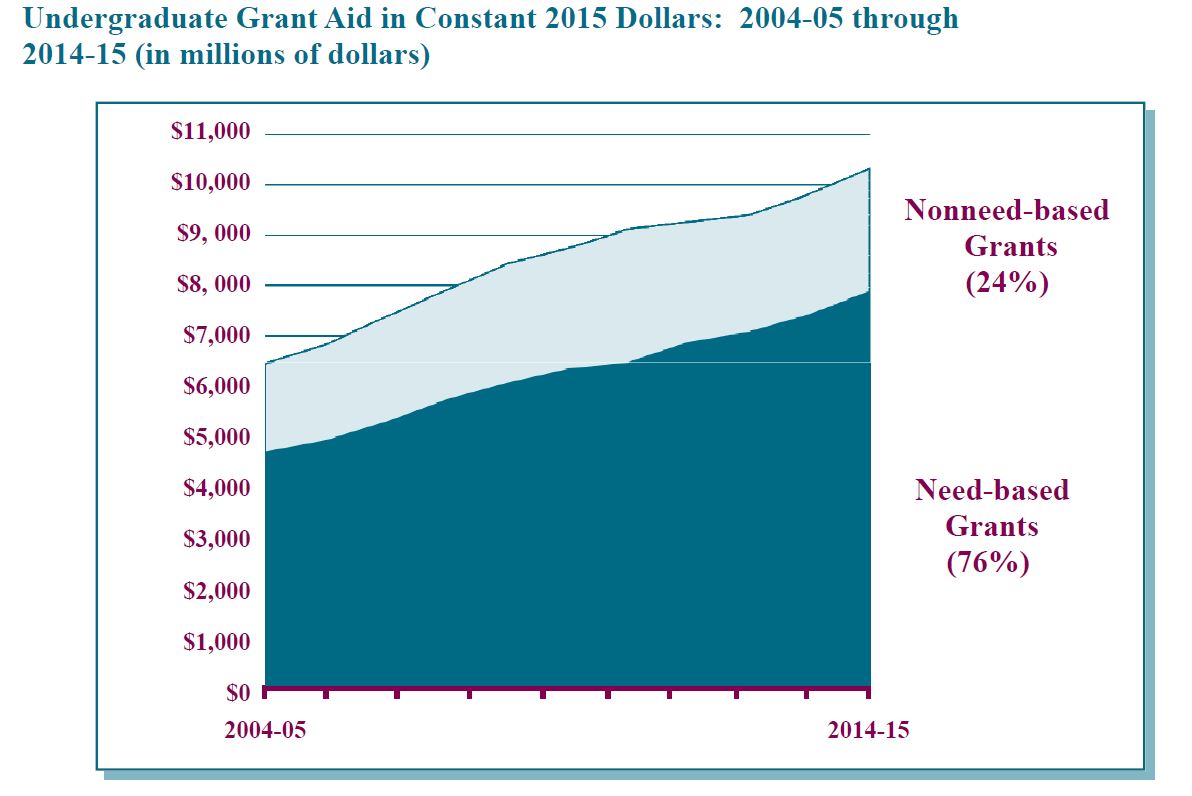
Just over three-quarters of grant aid, 76 percent, was need based, leaving 24 percent non-need based. The breakdown between need-based and non-need-based grants is roughly the same as the previous year, when need-based aid grew notably faster than other types of aid.
“I think there’s been a shift back a bit more to need-based aid from non-need-based aid,” said Frank Ballmann, director of NASSGAP’s Washington office.
Need-based aid can be used to attempt to encourage students who may not attend college to enroll. Non-need-based, or merit aid, is often seen as appealing to many students from wealthier families who will attend college with or without aid. It can be used to try to lure top students or keep them in state.
“Over all, the needle is still at 76 percent,” Ballmann said. “But ultimately, I think the states are more aware of the idea that getting the people who wouldn’t otherwise go to college to go to college benefits their state’s economy and the tax base.”
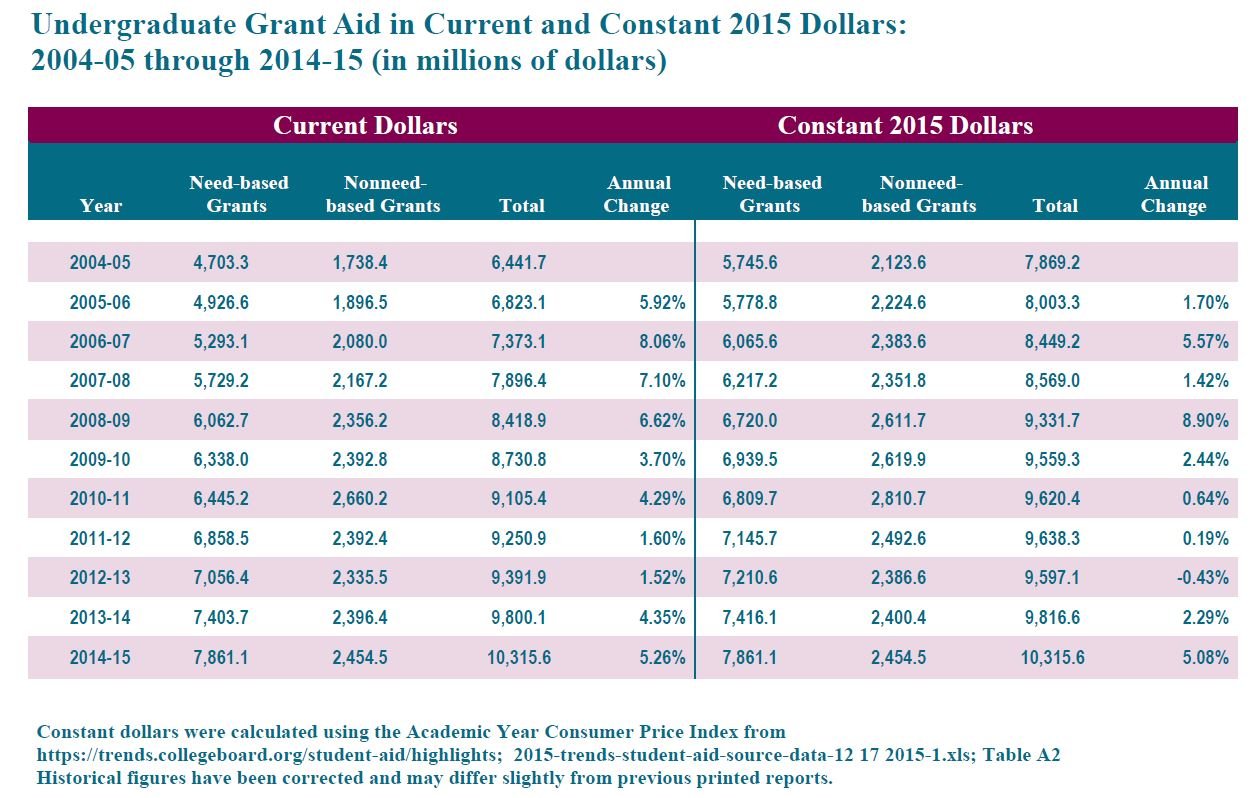
For undergraduates, need-based grant aid funding increased to more than $7.8 billion, up 6 percent when adjusting for inflation. Non-need-based grants rose by close to $2.5 billion, up an adjusted 2.2 percent. Overall undergraduate aid rose to $10.3 billion, up an adjusted 5.1 percent.
Most states reported operating state-funded undergraduate programs containing need components. But just eight heavily populated states collectively awarded 70 percent of all undergraduate need-based grant aid -- California, Illinois, New Jersey, New York, North Carolina, Pennsylvania, Texas and Washington. Two states, Georgia and New Hampshire, reported having no need-based aid programs.
Meanwhile, 25 states said they had undergraduate programs that made awards based only on merit -- although most simultaneously had programs awarding only need-based aid. Programs awarding only merit-based aid accounted for 18 percent of all aid to undergraduates. Programs that awarded only need-based aid made up 47.5 percent of all aid to undergraduates. Other programs and programs mixing need and merit components made up the remaining 34.5 percent of aid to undergraduates.
On a per-capita basis -- based on estimated overall population -- Georgia, Louisiana, South Carolina and West Virginia provided the most grant aid. Comparing undergraduate grant dollars to undergraduate full-time equivalent enrollment showed Georgia, South Carolina and Tennessee leading other states with high grant dollars. Comparing state-funded grant expenditures to total state support for higher education showed Louisiana, Pennsylvania, South Carolina, Tennessee and Washington leading with the highest proportion of grant expenditures.
Because state data lag, the new survey does not cover the most recent academic year, 2015-16, which could reflect high-profile budget issues affecting student aid in states including Illinois, Louisiana and Pennsylvania. Those issues might or might not show up in national data in future surveys, Ballmann said.
“At some point in the next year or two, we might see some individual states begin to show some budget strains in our report,” he said. “On the other hand, there might be some states that are investing more heavily. When California and New York go big, that can drown out a lot.”
Several changes to the financial aid process could show up in future surveys as well. An earlier submission timeline taking effect for the Free Application for Federal Student Aid and the ability for families to use prior-prior year tax data on the FAFSA could both affect student aid.
“It will be interesting to see how much that facilitates more people filling out the FAFSA and potentially increasing the demands for state aid,” Ballmann said. “It’s something each state will be looking at, to see how early FAFSA and the ease of IRS retrieval will increase demand for aid -- and potentially how legislators and governors respond.”
But those changes won’t be seen in the survey data for several more years. Here’s how total aid awarded changed by state and type in 2014-15.