You have /5 articles left.
Sign up for a free account or log in.
Professors A, B and C are old colleagues who work at three different regional public universities: one with 5,500 students in the rural South, one with 6,000 students in the Midwest and one large suburban university in California. They’re concerned about the future of faculty compensation, and they begin to compare notes about what each is earning in pay and benefits. It turns out the range is big -- really big -- from about $79,500 to $119,515 annually.
It’s probably unsurprising that the professor working in suburban California, with its high cost of living, makes the most. But beyond that, what exactly accounts for the pay gap? That’s the question behind a new paper offering another angle on faculty salary surveys, which are used by human resources personnel and faculty members alike to make informed decisions about how much professors should be paid in salary and benefits.
“This fictitious example describes a very real problem: trying to ascertain with precision salary and fringe benefits data for our nation’s public regional universities,” the paper reads. “In the age of the Internet, even well-informed business officers, human resource officers and faculty do not know how differences embedded in how institutions are grouped within the Carnegie Basic Classification obfuscate what we know -- and should know -- about key differences in institutional types across the American higher education landscape.”
In the end, full-time faculty members at large urban institutions made the most in monetary compensation, at $104,624, and those at rural, medium-size institutions made the least, at $84,720. Faculty members, regardless of location, also benefited from collective bargaining, to the tune of $21,010 in one year, on average.
The paper argues two things: that leaving fringe benefits out of salary surveys paints an incomplete picture of faculty compensation and that “the entire universe of public regional universities deserves analysis as a distinct sector of the American higher education landscape.” Lumping regional, access-oriented institutions with flagships for compensation comparisons just won’t do, the study says, and collective bargaining’s impact on compensation (or lack thereof) also demands attention.
“Monetary Compensation of Full-Time Faculty at American Public Regional Universities: The Impact of Geography and the Existence of Collective Bargaining” was released ahead of this week’s annual meeting of the National Center for the Study of Collective Bargaining in Higher Education and the Professions in New York. It was written by Stephen Katsinas, professor of higher education administration and director of the Education Policy Center at the University of Alabama, and two colleagues, Johnson Ogun, director of culinary arts at the University of North Alabama, and Nathaniel J. Bray, assistant professor of educational leadership, policy and technology at Alabama.
The paper examines monetary compensation of 127,222 full-time faculty employed by 390 regional members of the American Association of State Colleges and Universities, asserting that compensation data published by the Education Department and other organizations typically group all four-year public university faculty members together, regardless of workload (think two classes per semester versus four). Such data also neglect the impact of geography on compensation and inclusion of fringe benefits, which can make up 30 percent of what universities spend per professor, the paper argues.
Regional universities serve nearly four million students, according to the study, and accurate, nuanced data about how much their professors are paid is needed as a generation of baby boomers approaches retirement.
The authors took their data from the 2011 National Center for Education Statistics’ Integrated Postsecondary Education Data System (IPEDS), the most recent year for which data on both salary and fringe benefits were collected. They divided their 390 regional universities under study into seven categories, based on size and location, from rural and small to urban and larger. That’s more telling than Carnegie classifications, which typically go by highest degree awarded, according to the paper.
Over all, average total monetary compensation for the 127,222 full-time faculty employed by the 390 regional universities was $97,174, some $71,000 of which was salary, with about $26,000 in fringe benefits. Among the 15,872 full-time faculty employed by the 90 rural-medium regional universities, average compensation was $84,720. The 18,884 faculty employed by the 42 suburban-larger regional universities received $101,366.
Total Faculty Compensation, Based on Institution Type and Union Status
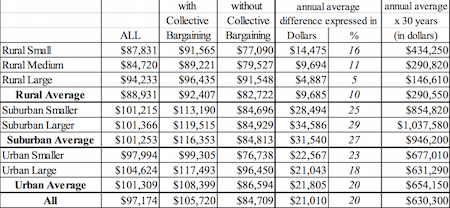
The one-year range for differences in pay is about $17,000, which would be much more, compounded over 30 years, or one’s career.
The presence of faculty unions on campus (as determined by their existence by state) makes an even bigger year-to-year difference, according to the study. About 60 percent of the faculty sample worked in states that have collective bargaining, while the rest worked in the 20 states that do not. Professors at rural, suburban and urban regional universities with collective bargaining received $92,407, $116,353 and $108,399 in total monetary compensation, respectively. Their nonunionized peers received $82,722, $84,813 and $86,594, respectively.
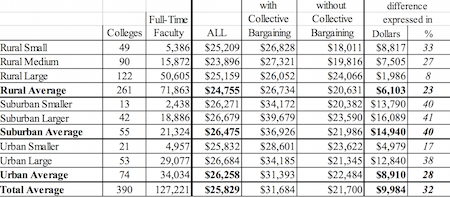
In terms of salary alone, average pay was $70,864 across the sample, with faculty members at large urban institutions being paid the most ($77,940) and those at rural, medium-sized institutions being paid least ($60,824). The one-year impact of collective bargaining was about $11,000, meaning that the approximately 74,000 unionized faculty members earned some $72,250 and those 53,000 without received $68,600.
In terms of benefits, average compensation for all faculty was $25,829. Large urban institutions paid most, at $26,684 and rural mediums again paid least, at $23,896. The one-year impact of collective bargaining on benefits was significant at nearly $10,000: faculty members with collective bargaining got $31,684 in benefits and those without got $21,700.
The right of public college employees to unionize is controlled by state, and it may be worth noting that regions that restrict this right (generally in the South) also have many states known for relatively frugal spending on higher education.
Faculty Fringe Benefits Based on Institution Type and Union Status
Katsinas said in a phone conversation that his research has important implications for practice, including disaggregation of data -- meaning that regional university data should be considered separately from research mission-driven flagship data. Geography matters, he said, in that assessing one’s institutional peers recognizing place-based differences in masked data averages. And rural institutions need some attention, since it’s a major challenge to recruit and retain faculty members in high-poverty areas.
Collective bargaining also counts -- especially considering that over the course of a professor’s career the difference between having it and not can exceed $1 million (adjusted for inflation).
Implications for policy and research include that “we’re on our own,” in terms of collecting fringe benefit data, since the Education Department stopped collecting it in IPEDS surveys, Katsinas said. Yet “good data” are still needed, since administrators and faculty rely upon it to build solid compensation plans. He suggested that other national organizations take up the task.
Andy Brantley, president and chief executive of the College and University Professionals Association for Human Resources, said in an interview that the study was valuable in that it offered yet another “lens” on faculty salaries -- not a definitive new take. For example, he said, while the unionization finding is significant, if not already obvious, considerations of discipline and rank are missing from the new analysis (those factors are included in CUPA-HR's own survey). Yet they’re major determinants on many campuses of how much professors get paid. And while it’s good to know how much universities spend on fringe benefits, there’s no indication of their quality, he said.
Perhaps most importantly, Brantley said, “national data should always be just one benchmark that institutions consider, but national data should never be used as the primary data source to determine salaries for an institution.” Instead, he said, institutions should be able to carefully determine for themselves, based on a variety of data, which colleges or universities make up their peer group.
Challenging the notion that the new survey was somehow superior to CUPA-HR’s faculty salary survey or others, Jackie Bichsel, CUPA-HR’s director of research said, “Which survey you use really depends on the lens through which you want to view this. … You’re not comparing apples to apples.”
John Barnshaw, director of higher education research at the American Association of University Professors, also noted that other surveys, namely the AAUP’s Annual Report on the Economic Status of the Profession, do take geography (by region) and benefits (as a percentage of total compensation) into account. It also breaks down institutions by type, including master's degree-granting institutions. Such information isn’t the “top-line” data that’s commonly talked about, he said, but it’s there.
Barnshaw also pointed out that fringe benefits, a focus of the new paper, don’t take tuition remission into account, which is a major benefit for many faculty members with families. It also relies on older data, which doesn’t meet the immediate, practical needs of human resources personnel looking to build their payrolls for next year.
Still, he said, the data are useful from an academic standpoint, especially those concerning unions. “It’s worth highlighting that unionization and collective bargaining are related to higher salaries and fringe benefits.”