You have /5 articles left.
Sign up for a free account or log in.
University of Chicago
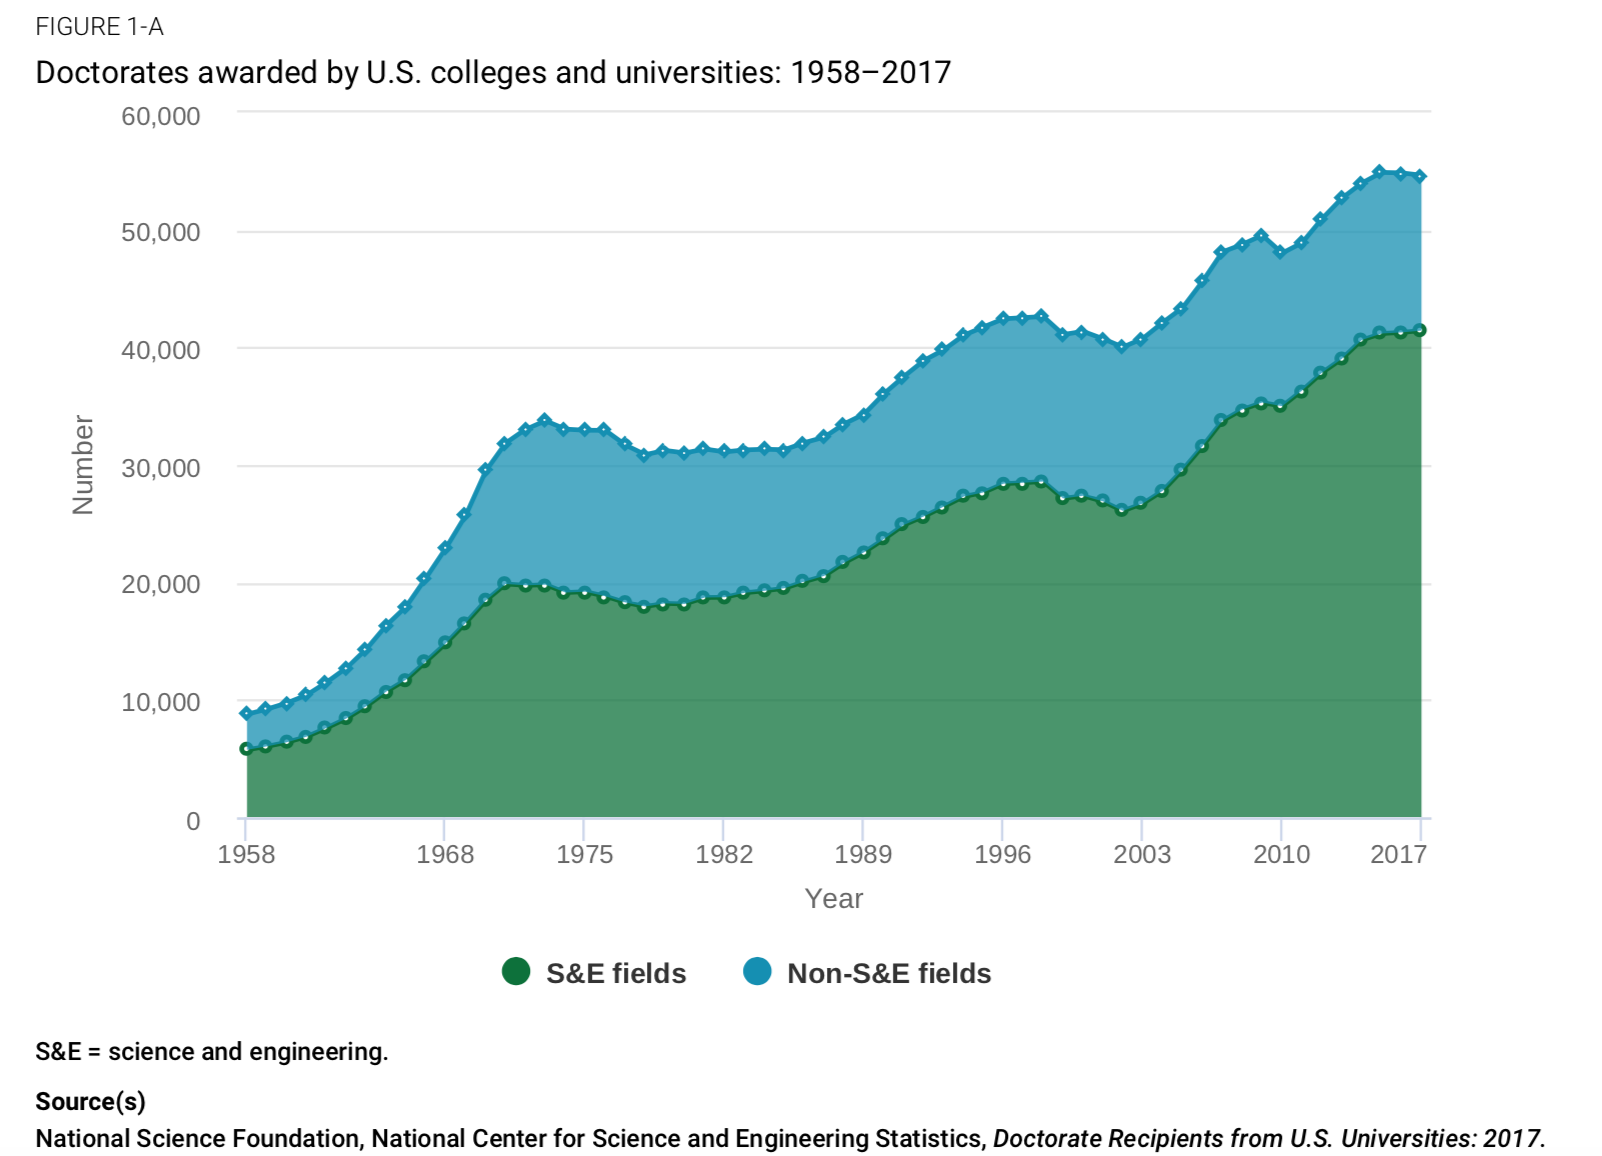
The number of U.S. doctorates awarded in 2017 fell slightly year over year, to 54,664 from 54,862, according to a new report based on data from the federal Survey of Earned Doctorates.
As in years past, science and engineering doctorates made up the vast majority of degrees awarded -- and actually increased in number by 249, to 41,438. But the number of non-science and engineering degrees awarded in 2017 fell by 356, to 13,226, the lowest figure since 2012. It is the latter category of disciplines in which job market has been tightest for years.
Taking a longer-term view, science (including social science and psychology) and engineering doctorates climbed from 58 percent of all doctorates awarded in 1977 to 76 percent in 2017. The number of non-science and engineering doctorates awarded in 2017, meanwhile, was slightly lower than the number awarded in 1977.
Every broad science and engineering field except for psychology and social sciences increased in number and share of doctorates granted over the past two decades, the report notes. Psychology and social sciences grew in terms of degrees granted, but declined in overall share of new Ph.D.s, from about 17 percent in 1998 to 16 percent in 2017. Engineering saw the biggest growth of all fields within the last 20 years.
Between 2016 and 2017, the life sciences held steady at about 30 percent of all doctorates granted, as did the physical and Earth sciences, at about 11 percent. Math and computer science represented about 7 percent of all degrees in each year. Engineering increased from 17 percent to 18 percent.
In nonscience fields, education doctorates fell steeply between 1998 and 2017, from about 15 percent of all doctorates granted to 9 percent. Arts and humanities degrees dropped from about 13 percent to 10 percent. Other fields, such as business management and communication, continued to represent about 5 percent of all doctorates awarded over that time period.
Foreign languages and literature Ph.D.s conferred increased slightly year over year, from 599 in 2016 to 624 in 2017. History fell from 1,148 to 1,066.
Story by Numbers
The survey, sponsored by the National Science Foundation, the Education Department, the National Endowment for the Humanities and other agencies, is an annual census of research degrees awarded in the U.S. Both annual and longer-term trends tell the story of who is getting advanced degrees and in what.
As the report says, “Annual counts of doctorate recipients from U.S. universities are measures of the incremental investment in human resources devoted to science, engineering, research, and scholarship, and they can serve as leading indicators of the capacity for knowledge creation and innovation in various domains.”
The survey began in 1957. Since then, the gap between science and nonscience fields has continued to widen. The overall number of degrees awarded has ebbed and flowed, but the average annual growth is about 3 percent.
The changing characteristics of the new Ph.D. population over time reflect “political, economic, social, technological and demographic trends and events,” the report says. And, it warns, “continued preeminence of U.S. doctoral education is not assured. Other nations, recognizing the contributions doctorate recipients make to economies and cultures, are investing heavily in doctoral education. The world’s brightest students, including U.S. citizens, may go elsewhere for the doctoral degree, and they may begin careers elsewhere as well.”
That may already be happening: first-time international graduate enrollments in U.S. institutions fell 3.7 percent from fall 2016 to fall 2017, according to a recent report from the Council of Graduate Schools.
The new federal report says that the number of doctorates in science and engineering awarded to temporary visa holders was 14,166 in 2017, down 159 from 2016. Overall growth in this area was still up 77 percent since 1998 and 9 percent since 2008, however. The proportion of science and engineering doctorates awarded to temporary visa holders peaked at 41 percent in 2007, the report says, but has held steady at around 36 percent since 2011.
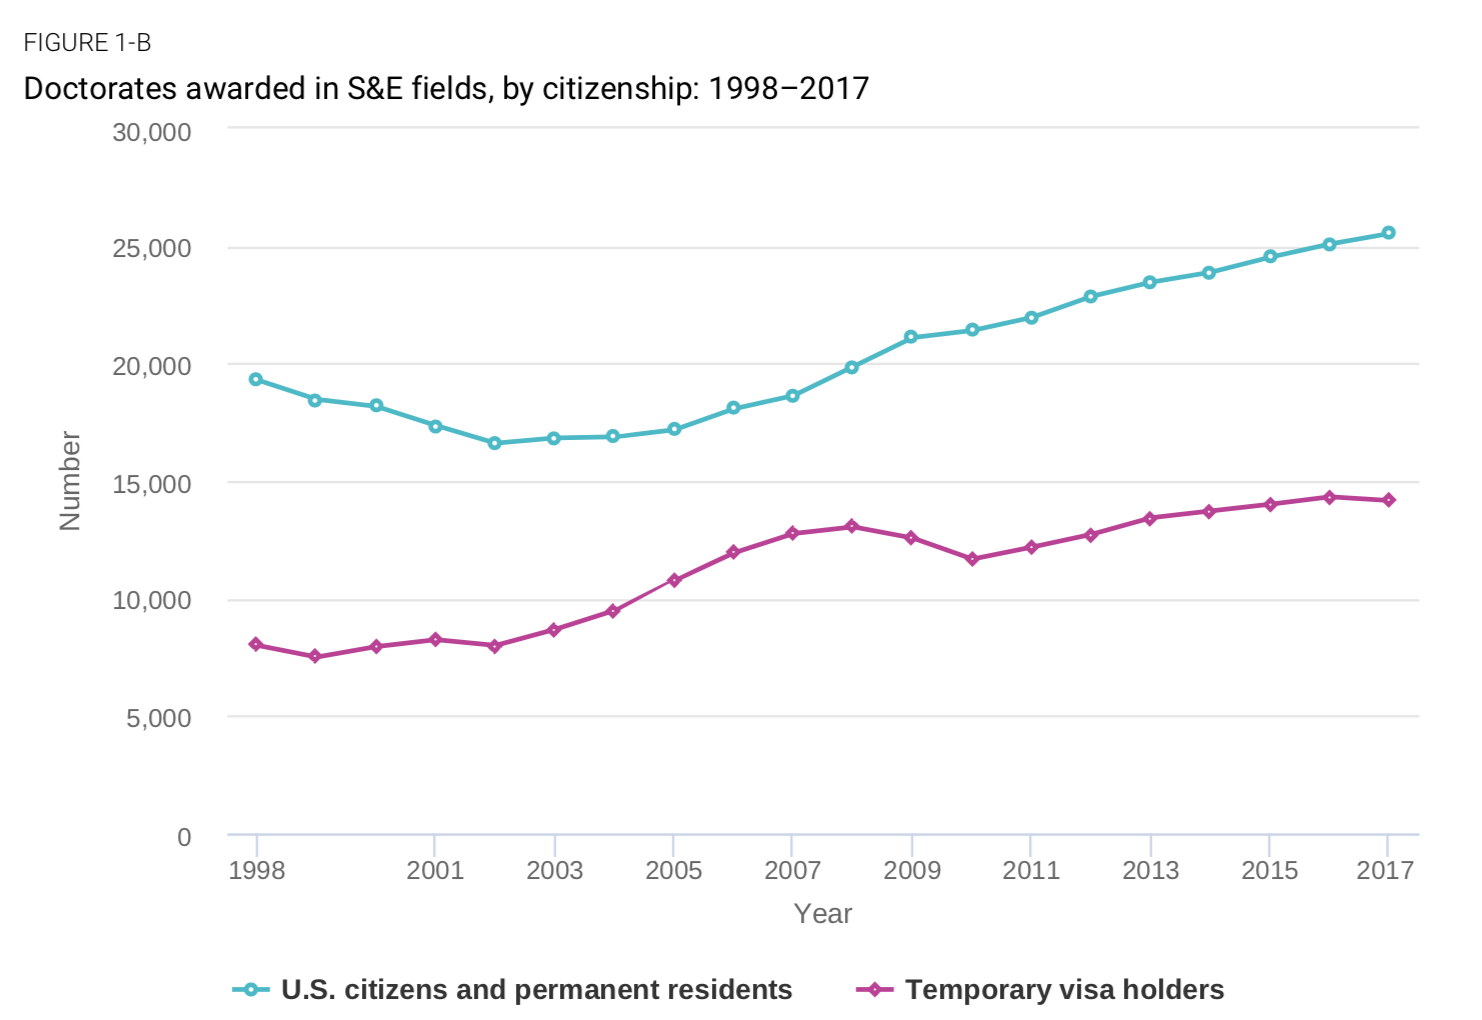
Among U.S. citizens and permanent residents, the number of science and engineering degrees awarded grew by 2 percent year over year, but experienced slower growth over all.
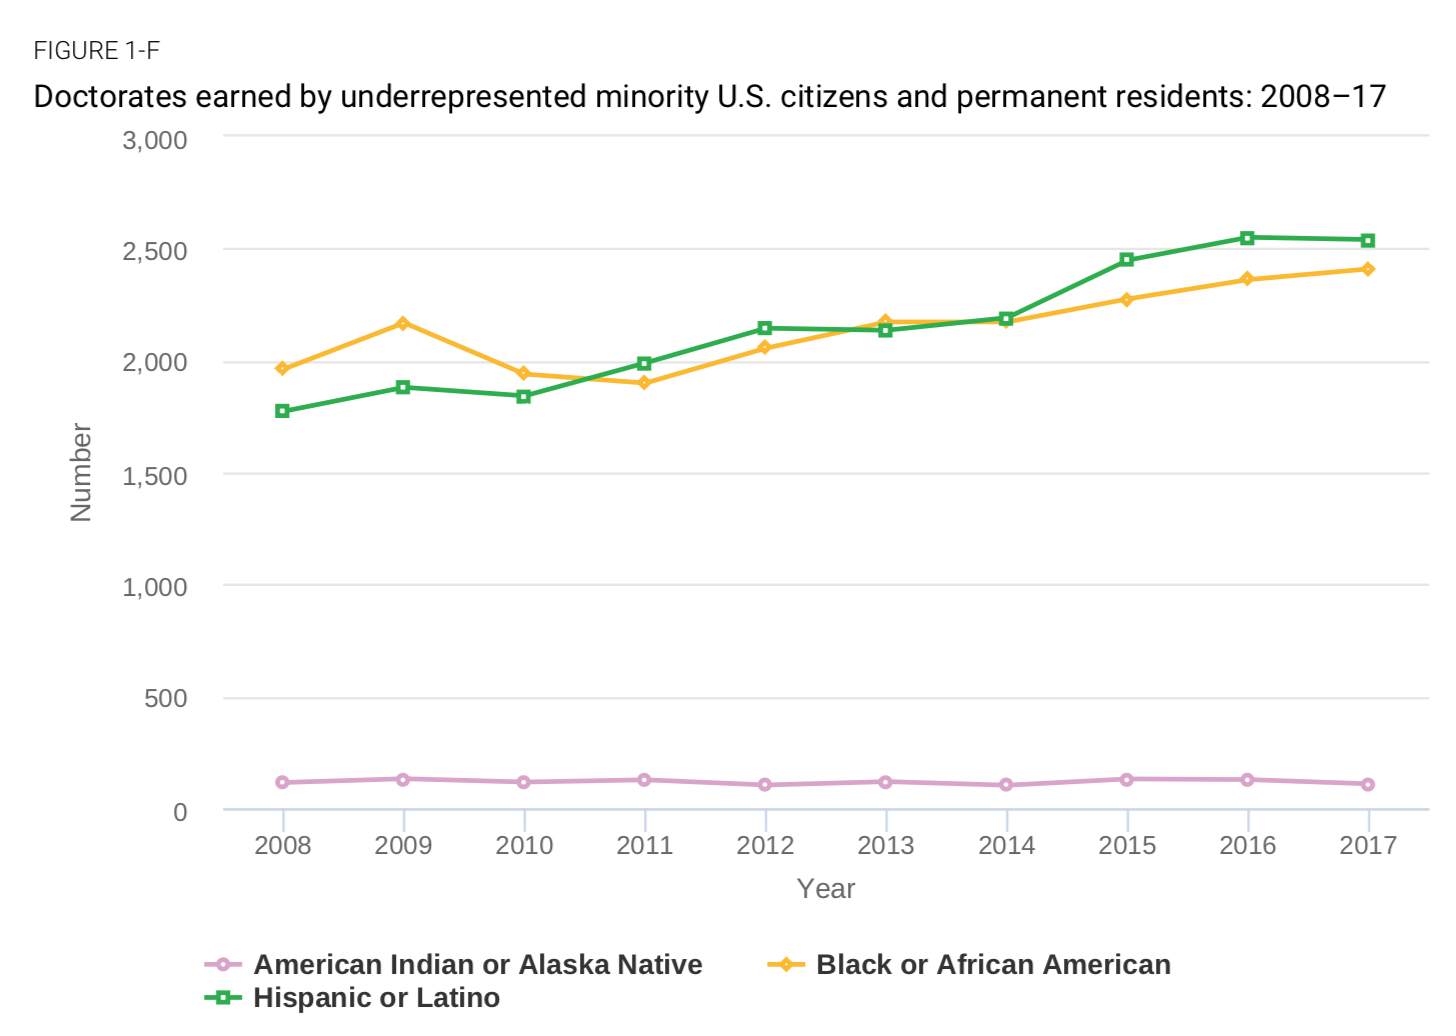
Asian Americans earned more doctorates than any other racial and ethnic minority groups in life sciences, physical sciences and earth sciences, mathematics and computer sciences, and engineering. Blacks or African Americans were the largest U.S. minority population in education. Latinos earned a larger share of doctorates in psychology and social sciences and in humanities and arts than did any other minority group.
Women’s share of doctorates awarded has grown in the past 20 years in all broad fields. Women earned the majority of doctorates awarded in life sciences, psychology and social sciences education, and humanities and arts in 2017. They earned about one-fourth of engineering and mathematics and computer science doctorates. Still, their ranks in those latter fields have been growing, from about 13 percent in engineering in 1998 and 22 percent in computer science and engineering.
Interestingly, the parents of recent doctoral recipients are better educated than parents of earlier Ph.D. cohorts. The share of new Ph.D.s with a parent who didn’t graduate college, meanwhile, has declined in the past 20 years. Research assistantships are the most frequent primary source of financial support for all doctorate recipients, followed by fellowships or grants and teaching assistantships. Sixteen percent of doctoral students rely primarily on their own resources, such as loans, personal savings, personal earnings or spouse or family, and 5 percent relied on such other sources as employer reimbursement and foreign support.
Most students (71 percent) in the physical and earth sciences, math and computer science, engineering and life sciences reported having no education-related debt. In psychology and social sciences and the humanities and arts, along with other non-science and engineering fields, only half of students said that. The shares of doctoral students with debt burdens of more than $30,000 were education (37 percent), psychology and social sciences (30 percent), and humanities and arts (26 percent).
Time to degree in 2017 ranged from about six years in the physical and Earth sciences to double that in education. In the humanities and arts, it was more than nine years.
The share of 2017 doctorates with definite commitments for employment increased slightly from 2016 across fields.
Salaries for those with definite job commitments varied widely in 2017, however, from about $50,000 for postdocs in most fields to $125,000 for mathematicians and computer scientists employed in business. In every broad field, reported postdoc salaries were lower than salaries for doctorate recipients entering non-postdoc employment in industry or academe. The biggest starting salaries in academe in non-postdoc positions were seen in engineering and “other” fields, such as business.
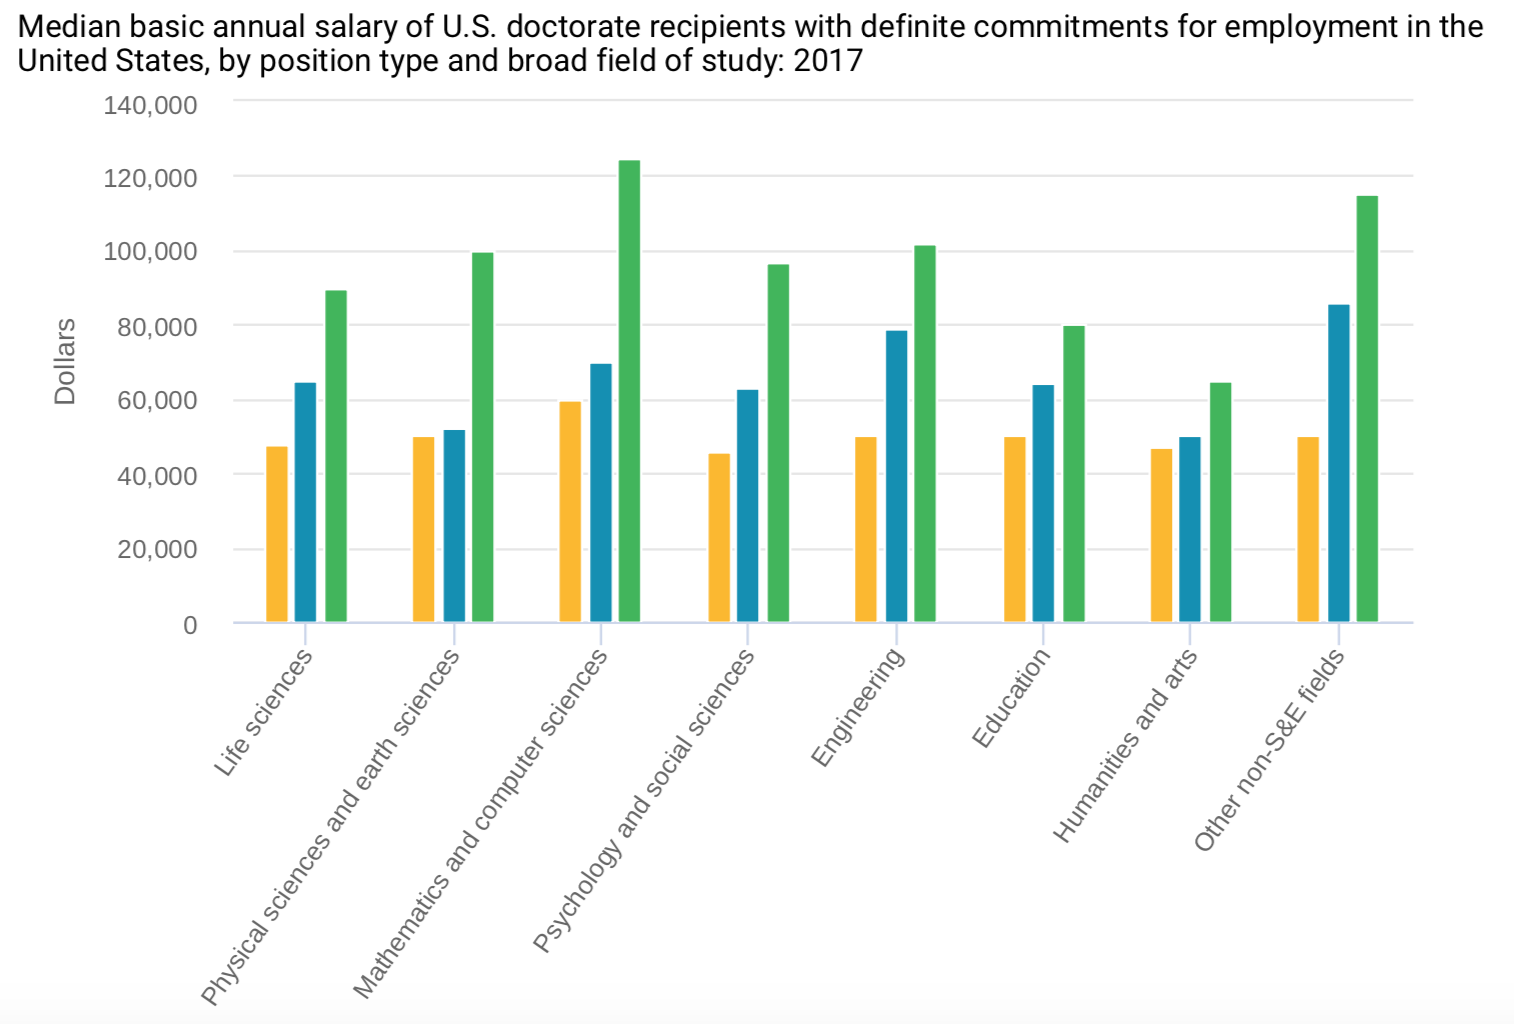
Nearly half (46 percent) of doctoral recipients with definite employment commitments, excluding postdocs, reported plans to work in academe. Academic employment plans were most prominent among those in the humanities and arts (77 percent), and “other” fields (80 percent). The lowest rates were in engineering (14 percent) and the physical and Earth sciences (24 percent).
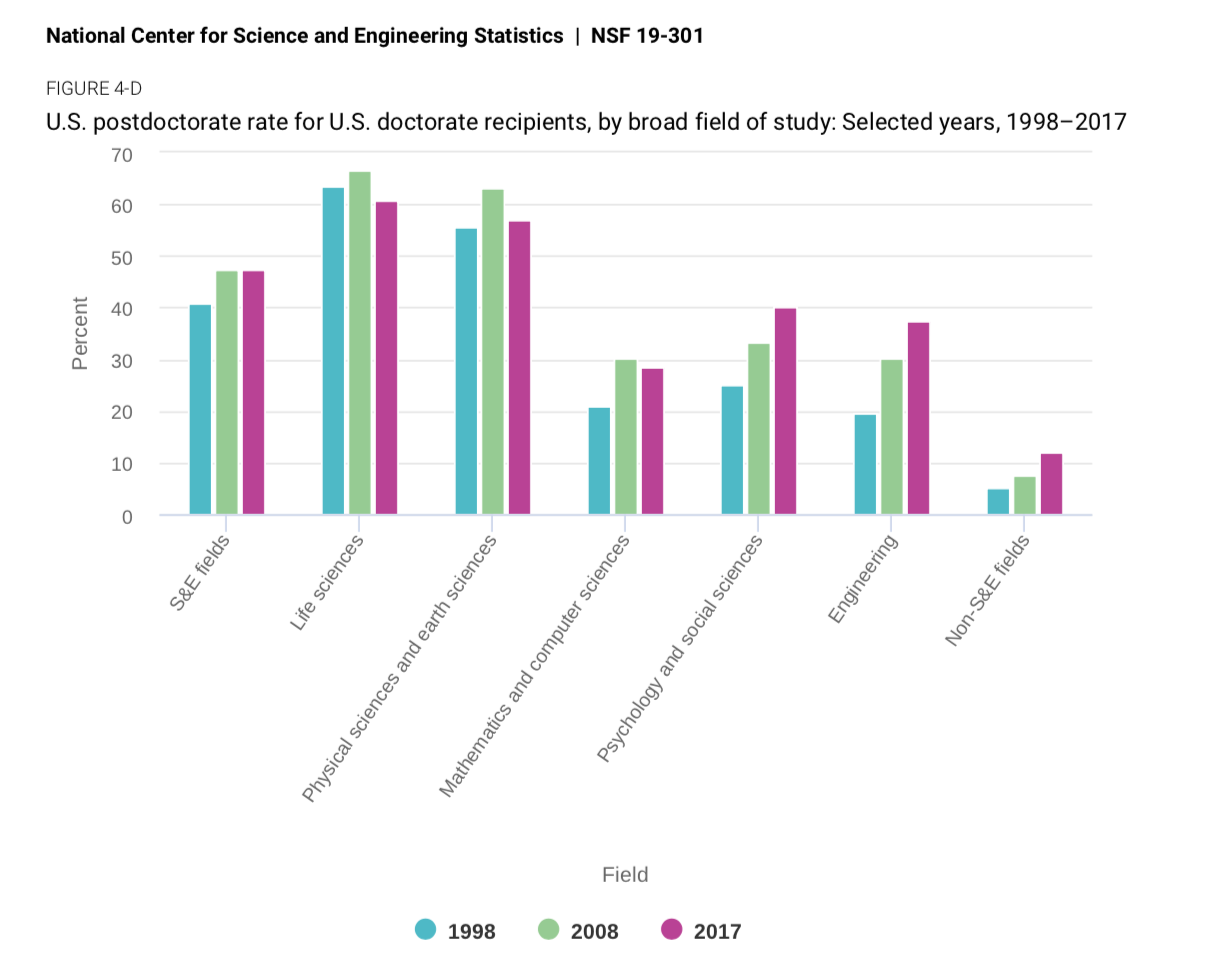
The overall rates of scientists and engineers taking postdocs has remained at about 47 percent over the last decade. Rates have increased in engineering and psychology and the social sciences but decreased in other sciences over that time. Rates of non-science and engineering Ph.D.s taking postdocs continue to increase over time, to about 12 percent in 2017.
Robert B. Townsend, director of the Washington office of the American Academy of Arts and Sciences, studies Ph.D. outcomes. He said that whenever he gives talks around the country on the topic, "quite a few people” ask why the number of humanities Ph.D.s remains high, despite the sharp drop in academic jobs after the 2008 recession. The 3.5 percent year-over-year decline in arts and humanities Ph.D.s conferred indicated in the report is therefore interesting, he said.
Still, he cautioned, there are “notable splits between the disciplines, which makes it hard to discern a trend.” Foreign language Ph.D.s increased 4.2 percent, for example, after falling in recent years, and some even smaller fields saw double-digit increases. Conversely, Townsend said, there were "substantial" declines in history, along with American literature and philosophy.
Given that it takes an average of seven years to earn a Ph.D., and that tracking studies have only recently reported declines in program enrollment, he said, “I suspect a broad and sustained decline is still a few years off.”
Hironao Okahana, associate vice president for research and policy analysis at the Council of Graduate Schools, said the annual survey is an “invaluable national data resource” for institutions and others interested in higher education.
Pointing to the findings about definite employment commitments, Okahana said said that after several years of “slow decline,” the council is “cautiously optimistic at the slight improvement.” The uptick in employment in industry and nonprofits also seems to signal a "recognition of the value of doctoral of education across employment sectors,” he added.