You have /5 articles left.
Sign up for a free account or log in.
Research university administrators are understandably jittery about the fiscal cliff facing policy makers in Washington, given the prospect that federal budget cutbacks would shave -- if not savage -- government funds for academic research and development.
A report released Wednesday by the National Science Foundation provides a reminder about how painful the fall off the cliff might be. The agency's annual look at research spending by universities -- which is driven heavily by federal funds -- shows that R&D spending surged to its highest level ever in 2011, to $65.1 billion. That was up 6.3 percent from 2010's $61.2 billion, with both years' figures inflated by funds included in the economic stimulus law that Congress passed in 2009.
That money leveled off in 2012 and vanished entirely by the current 2013 academic year, and federal funds for research -- like most other non-defense discretionary programs in the federal budget -- could get whacked (in an across-the-board 8.2 percent cut) if Congress doesn’t pass a long-term plan to deal with the budget deficit, and a host of expiring tax provisions are allowed to lapse. So it is possible that the 2011 figures will represent a high-water mark for some time to come.
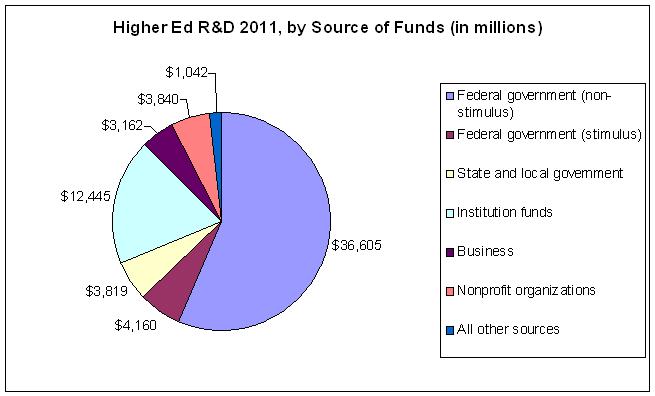
As seen in the chart below, nearly two-thirds (62.6 percent) of all money spent on research and development by the 912 academic institutions surveyed by the science foundation came from the federal government; about 10 percent of that total came through the stimulus legislation. The next-largest segment came from institutions themselves.
As has been true in recent years, biomedical science fields dominated the research spending by the government and institutions alike. More than $37 billion of the $65 billion total was allocated for the life sciences, with engineering a distant second of the broad fields.
| Field | Fiscal 2010 | Fiscal 2011 | % change 2010–11 |
| All R&D fields | $61,191 | $65,073 | 6.3% |
| Computer sciences | 1,637 | 1,735 | 6.0 |
| Environmental sciences | 2,992 | 3,167 | 5.8 |
| Life sciences | 34,924 | 37,232 | 6.6 |
| Mathematical sciences | 592 | 636 | 7.4 |
| Physical sciences | 4,619 | 4,779 | 3.5 |
| Psychology | 1,075 | 1,119 | 4.1 |
| Social sciences | 1,991 | 2,045 | 2.7 |
| Other Sciences | 1,154 | 1,132 | -1.9 |
| Engineering | 9,327 | 10,045 | 7.7 |
| Non-science and engineering | 2,880 | 3,183 | 10.5 |
And roughly 40 percent of all research and development funds spent by colleges and universities in 2011 was spent by the top 30 institutions, which are listed below.
Top 30 Institutions in Research Expenditures, 2011 (in millions)
| Institution | Total Research Expenditures, 2011 | Federally Provided Research Funds, 2011 |
| Johns Hopkins U. | $2,145 | $1,884 |
| U. of Michigan | 1,279 | 820 |
| U. of Washington | 1,149 | 949 |
| U. of Wisconsin at Madison | 1,112 | 594 |
| Duke U. | 1,022 | 585 |
| U. of California-San Diego | 1,009 | 637 |
| U. of California-San Francisco | 995 | 570 |
| U. of California-Los Angeles | 982 | 563 |
| Stanford U. | 908 | 656 |
| U. Pittsburgh, main campus | 899 | 663 |
| U. of Pennsylvania | 886 | 707 |
| Columbia U. | 879 | 646 |
| U. of Minnesota-Twin Cities | 847 | 489 |
| OH State U. | 832 | 493 |
| Penn State U. | 795 | 469 |
| Cornell U. | 782 | 476 |
| U. NC, Chapel Hill | 767 | 562 |
| U. of Florida | 740 | 306 |
| Washington U. in St. Louis | 725 | 469 |
| Mass Institute of Technology | 724 | 489 |
| U. of California-Berkeley | 708 | 336 |
| U. of California-Davis | 708 | 363 |
| Texas A&M U. | 706 | 291 |
| U. of Texas M. D. Anderson Cancer Ctr. | 663 | 236 |
| Yale U. | 657 | 520 |
| Georgia Institute of Technology | 655 | 428 |
| Harvard U. | 650 | 543 |
| U. of Texas-Austin | 632 | 355 |
| Northwestern U. | 619 | 400 |
| U. of Arizona | 611 | 328 |
Source: National Science Foundation


